Long Term Perspective
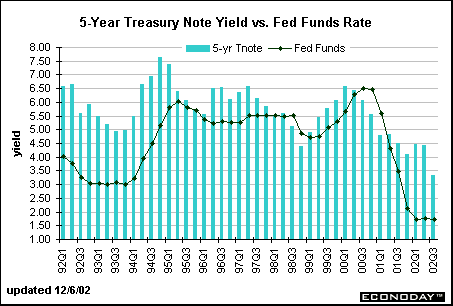
The spread between the 5-year Treasury note and the federal funds rate averaged -189 basis points in the 1980s. This was a period of high interest rates and (relatively) high inflation. The spread became positive in the 1990s, averaging 116 basis points.

Short Term Perspective
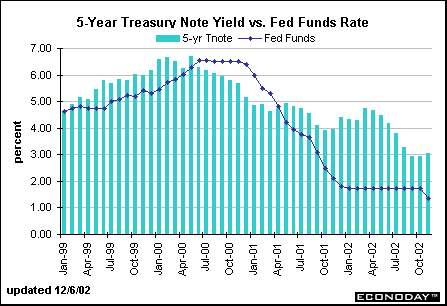
The spread between the 5-year note yield and the federal funds rate averaged +28 basis points in 2000-01. The yield on the 5-year note was higher than the fed funds rate throughout 1999 and the first half of 2000 as market players expected the Fed to tighten monetary policy. As economic conditions changed, and investors believed that the Fed would reduce the fed funds rate target, the yield on the 5-year note fell below the funds rate in the second half of 2000. The spread turned around in 2001 after the Fed began to ease aggressively. The yield on the 5-year note inched up slightly in November causing the spread between the federal funds rate and this Treasury security to widen a bit.


About the Bond Market • Bond Market Charts • Treasury Market Charts • Treasury Auctions
|