Long Term Perspective
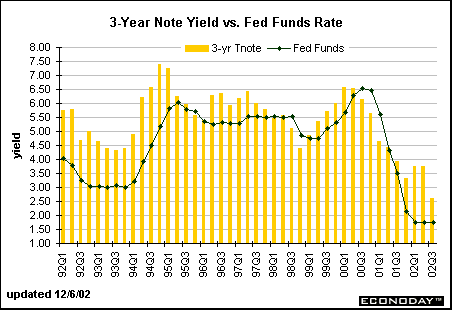
The spread between the 3-year Treasury note and the federal funds rate averaged -181 basis points in the 1980s when interest rate levels were generally much higher than they are today. The spread turned around in the 1990s to average +83 basis points.

Short Term Perspective
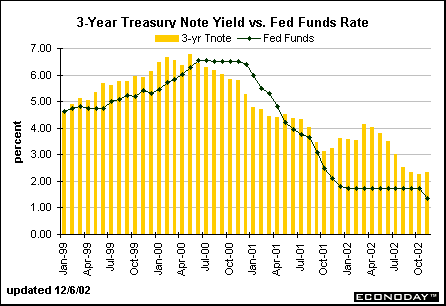
The spread between the 3-year note and the federal funds rate averaged +8 basis points in 2000-01. Note how the spread was positive in 1999 and 2000 when market expectations were focused on Fed tightening. When market sentiment shifted towards expected easing, the yield on the 3-year note was lower than the federal funds rate. The yield on the 3-year note edged up in November after declining for seven straight months. No one expects imminent rate hikes, but investors think that the rate cuts are over for this cycle.


About the Bond Market • Bond Market Charts • Treasury Market Charts • Treasury Auctions
|