 |

Long Term Perspective
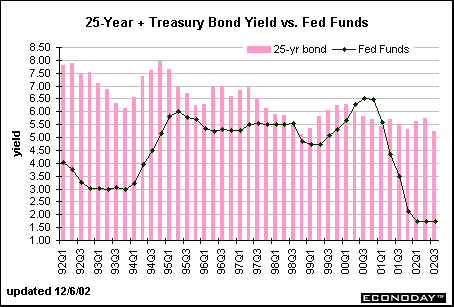
Since the Treasury is no longer issuing new 30-year bonds, the Fed is no longer calculating an average yield for 30-year bonds. As of late February, they have begun to calculate average yields for 25-year and over bonds. Essentially, these are 30-year bonds through February data, but become 25-year + bonds beginning with March 2002. In order to have a long term history of this "new" series, they have set data prior to February equal to the average yields on the 30-year bonds. Thus, our historical data doesn't look any different because it is the same! From now on, we will simply give it a new name.
The average spread between the 25-year Treasury bond and the federal funds rate was 184 basis points in the 1990s, a far cry from the -189 basis point spread averaged in the 1980s. One would expect long term rates to be higher than short-term rates since a liquidity premium is built into the normal yield curve. The 1980s was an unusual period with high interest rates and two back-to-back recessions. The year 2000 also brought unusual behavior to the 30-year bond. Since the Treasury announced that it would reduce the quantity of 30-year bonds offered in the market, a premium developed for these long term issues causing their prices to rise and their yields to fall (below the federal funds rate). The Treasury went even further in October 2001 when they announced the indefinite suspension of 30-year bonds.

Short Term Perspective
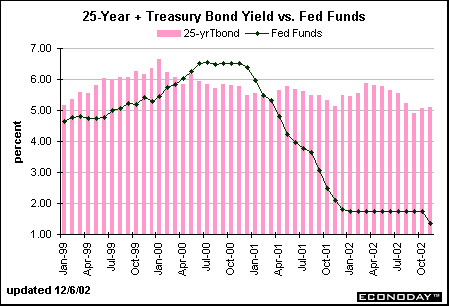
The spread between the 30-year bond yield and the federal funds rate averaged +65 basis points in 2000-01. The yield on the long bond peaked in January 2000 and was in declining mode for the next 18 months. To a large extent, the drop in the 30-year bond was due to the fact that the Treasury announced not only a reduced supply of new 30-year bonds, but also a buyback of old long bonds. This increased the premium on these bonds and reduced their yields. In the meantime, economic activity moderated - causing interest rates to generally head lower in anticipation of Fed easing. When the Fed did indeed ease aggressively, the old relationship between the fed funds rate and the long bond was re-established. Oddly enough, the 30-year bond yield varied by small amounts between 1999 and February 2002. Starting with March data, we are now looking at 25-year + bond yields. These are essentially the same 30-year bonds we were looking at before, but since the Treasury is no longer issuing new 30-year bonds, the old bonds no longer have a 30-year maturity as time goes on. Consequently, the Fed is calculating average yields on 25-year + bonds.
The yield on these long-term bonds edged up slightly in November as stock prices turned around. Yet, bond investors are still enjoying the lower interest rate environment.


About the Bond Market • Bond Market Charts • Treasury Market Charts • Treasury Auctions
|
 |