
Long Term Perspective
The spread between the yield on the 10-year Treasury note and yields on industrial bonds was generally lower than the spread between the Treasury bond and Corporate bonds. The spread was lower across the board from the highest rated (Aaa) to the lowest rated security (Baa). Interestingly enough, this was only true during the 1990s as a whole, but not for the 1980s or the years 2000 and 2001.
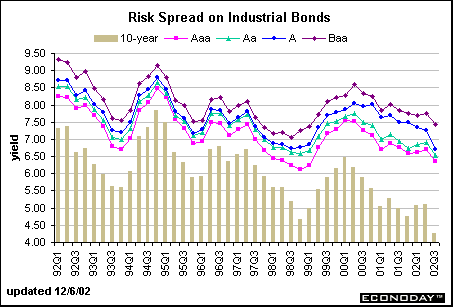
| Spread between Treasury Note and: | 1990s Average | Recession Average |
| Aaa Industrial Bond: | 93 basis points | 31 basis points |
| Aa Industrial Bond: | 121 basis points | 85 basis points |
| A Industrial Bond: | 138 basis points | 140 basis points |
| Baa Industrial Bond: | 186 basis points | 225 basis points |
Short Term Perspective
Yields appeared to come down in tandem in November but remain wide between industrial bonds and the 10-year Treasury note. This typically happens as economic conditions deteriorate because default risk increases. Investors are not seeing strong signs of recovery.
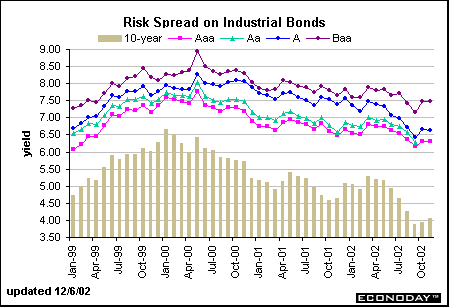
| Spread between Treasury Note and: | 2000-01 Average |
| Aaa Industrial Bond: | 153 basis points |
| Aa Industrial Bond: | 174 basis points |
| A Industrial Bond: | 225 basis points |
| Baa Industrial Bond: | 259 basis points |

About the Bond Market • Bond Market Charts • Treasury Market Charts • Treasury Auctions
|