No question, stock performance was atrocious this year. But equity investors can console themselves that 1974 was even worse for the Dow Industrials and the S&P 500. The NASDAQ composite index fell more sharply in 2000 than it did this year. Otherwise, this year ranks among the worst for stock-market returns in the past 35 years. The two years before weren't very good either. In fact, three years of consecutive declines are rare. The NASDAQ index has a shorter history than either the Dow or S&P - but has never recorded three straight yearly declines until now. Likewise, the S&P 500, developed in the late 1940s, has never before declined for three straight years. The last three-year drop for the Dow was way back, 1939-41. (During the Great Depression, the Dow plunged for four straight years, 1929-1933.)
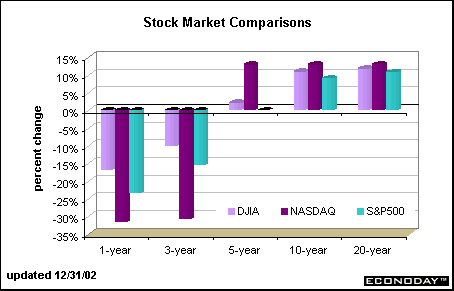
The chart below compares 1-year, 3-year, 5-year, 10-year and 20-year average annual changes in the key equity market indexes. Clearly, the NASDAQ composite fell more sharply in 2002 than either the Dow or the S&P 500. Even the 3-year average shows quite a plunge for the NASDAQ. Over the three years, the NASDAQ has retraced more than its entire 1999 gain of 85.6 percent. The 3-year returns for the Dow and S&P are also negative, although the declines are less dramatic then the loss for the technology-laden NASDAQ index.

Looking at the 5-year average, the S&P has inched down 0.1 percent while the Dow has inched up 2.2 percent. Here, however, the NASDAQ begins to post healthy gains. If an investor had bought the market index five years ago and held on to it, he would have realized a better 5-year return than with either the more conservative Dow or S&P 500 indexes.
It is only when we look at the 10-year and 20-year average returns on the major indexes that we see reasonable long-term averages. In both cases, the NASDAQ outperforms the two older indexes. Unfortunately, investors don't always have the luxury of waiting 10 years before selling their stocks. If young investors do have the patience to wait it out, their investments will likely recuperate. But those who are nearing retirement today, or who have already retired, may be devastated to see their wealth erode so severely.
The bottom line
Economic conditions themselves may not warrant such a sharp decline for the stock market. The market feels undervalued going into 2003, much as it seemed overvalued going into 2000. But investors have good cause for weariness. Aside from the corporate scandals that shook investor confidence in 2002, we approach 2003 with great uncertainty. War with Iraq appears a strong possibility and tensions with North Korea have become more strained. One can't pick up a newspaper without reading of terrorist plots.
But investors must focus closely on the market. The market peaked in 2000 when investors finally recognized that stock valuations surpassed corporate earnings. The momentum of the bull market could no longer build. There is no question that economic activity remained sub par during most of 2002. Capital spending didn't pick up until the end of the year, and then only meagerly. It was consumer spending - particularly housing - that kept the economy afloat. When investors feel comfortable that the economy is recovering from recession and the uncertainty surrounding geo-political risks subside, the bull will certainly return.

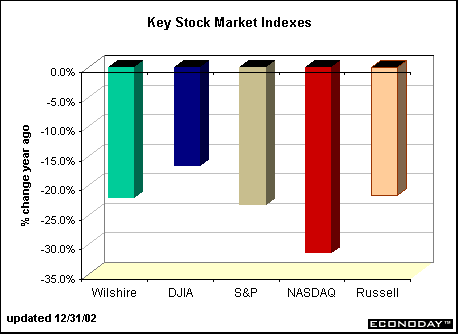
The Wilshire 5000 fell 22.1 percent in 2002; the Dow Jones Industrial Average declined 16.8 percent; the S&P 500 decreased 23.4 percent; the NASDAQ composite index plunged 31.5 percent; and the Russell 2000 dropped 21.6 percent in 2002.
Evelina M. Tainer, Chief Economist, Econoday
|
![[ST Archive]](../images/starchive.gif)
