Financial industry stock prices typically appreciate when interest rates are declining since lower rates spur borrowing and fatten profit margins.
However, interest rates don't spread the wealth evenly.
Our comparison will include two mortgage companies (Countrywide Credit Industries and Fannie Mae), two full-service brokerage firms (Merrill
Lynch and American Express), and a discount broker (Charles Schwab). Though similar, these firms are diverse. Fannie Mae repackages
mortgage obligations and sells them in the secondary market, and its securities are, for all practical matters, guaranteed by the federal
government. Countrywide is a mortgage-banking firm that originates, purchases and sells mortgages. American Express is probably more
diversified than Merrill Lynch given its credit card operations and travel services in addition to its brokerage services. Charles Schwab has
widened the services it offers the past several years. Perhaps it's better considered a "semi" discount broker.
Using interest rates as a predictor
Looking at the year-over-year changes in our five companies, we find that interest rates do indeed help determine the direction of stock prices.
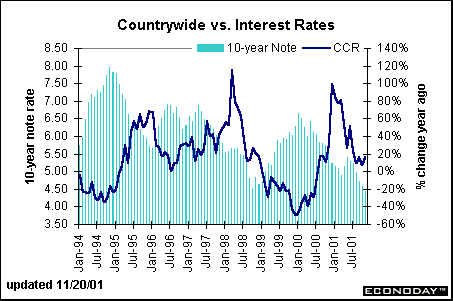
Notice in the chart below, which depicts the year-over-year change in the stock price of Countrywide Credit relative to interest rate levels, that
the shares declined when interest rates rose but rose when interest rates declined. The picture for Fannie Mae is virtually identical except that its
stock surged more dramatically in 1996. Both Countrywide and Fannie Mae showed a drop at the beginning of 2001 even though interest rates
were declining. This is likely related to expectations that a slowdown in economic activity was expected to dampen demand for housing and
mortgages. We in fact did see a mild drop in mortgage demand, but nothing dramatic.
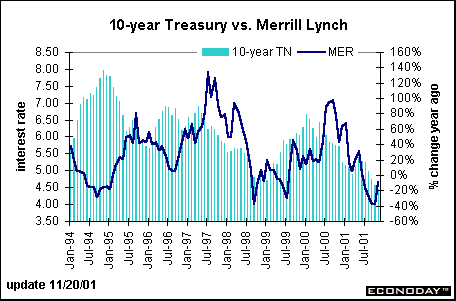
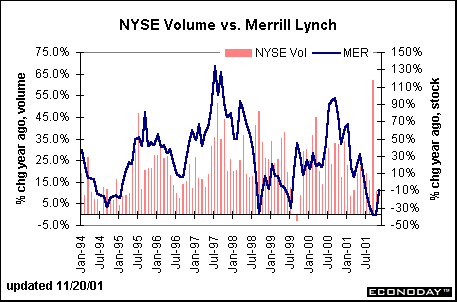
The chart below compares one of our brokerage firms, Merrill Lynch, to the levels of the 10-year Treasury note. In a similar fashion, the price of
this company's stock rose when interest rates fell and fell when interest rates rose. The major difference between Merrill and Countrywide occurs
in 2000, when Merrill's stock price begins its descent. The pattern for American Express is similar to Merrill Lynch, but its stock price peaked
several months earlier.
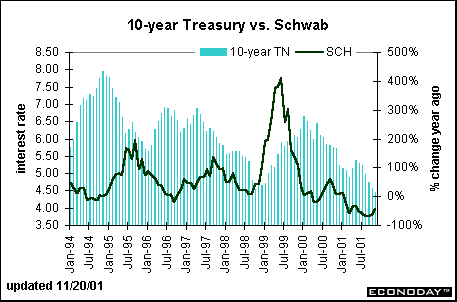
Charles Schwab's stock price is also correlated to interest rates, but the pattern of this company's stock varies to some degree from both Merrill
Lynch and American Express.
Using other indicators as predictors
Interest rates show the best correlation between stock prices of Countrywide and Fannie Mae. We looked at the relationship with housing starts,
but found that the monthly volatility of starts tended to negate its reliability as confirming evidence. Anyway, interest rates affect housing starts, so
we are really getting at the core determinant of mortgage demand in one fell swoop.
But we can look at other indicators to help us determine the direction of stock prices for Merrill, American Express and Schwab. The first
indicator that comes to mind, of course, is the stock market itself. When equities are in a bull market, more investors will be trading and this will
help the bottom line for brokerage firms. Conversely, trading volumes thin out during bear markets, hurting these firms' bottom line.
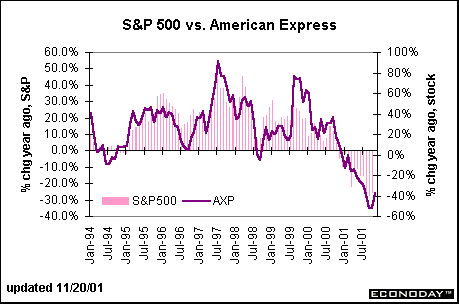
In fact, look how the year-over-year change in the stock price for American Express moves almost exactly in line with the year-over-year change
in the S&P 500. In contrast, Merrill Lynch's stock price moves more closely in line with volume on the New York Stock Exchange.
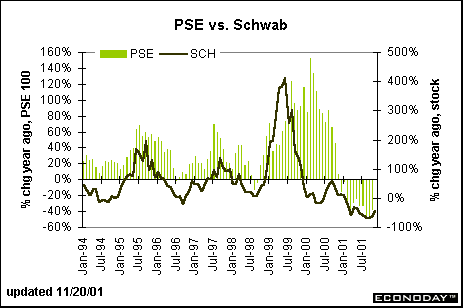
Changes in Charles Schwab's stock price don't follow either of these indicators very well. Given that Schwab is considered more of a discount
broker with a strong tendency toward online trading, we guessed that the movement in Schwab's stock price would parallel the Nasdaq
composite index. Remember that the Nasdaq jumped much more sharply than the S&P 500 in the past couple of years and then retreated more
dramatically, as was the case for Schwab's stock price. As it turns out, however, neither volume in the Nasdaq market nor year-over-year
changes in the Nasdaq composite index did a better job of explaining the changes in Schwab's stock price than the S&P 500. In fact, Schwab
moved more in line with the PSE 100 (Pacific Stock Exchange index of 100 technology companies). As shown in the chart below, the changes
in the PSE 100 were even more dramatic than the changes in the Nasdaq composite index since it focuses on technology issues. It could be
that investors viewed Schwab as a technology play more than a brokerage/financial company investment.
The bottom line
The financial industry is closely aligned with changes in interest rates, with declining rates usually resulting in greater profits and higher share
prices. But it is important to note that not all financial companies react in the same manner to interest rate changes. For instance, mortgage
companies are closely tied to the housing market and have a strong correlation. Brokerage companies are also affected by general stock
market movements and trading volumes. Even among the various financial companies, you will find a degree of diversity. Remember that
American Express has a greater range of businesses under its umbrella than Merrill Lynch or Charles Schwab. Thus, its bottom line could be
impacted by any number of factors not relevant to the average financial company. Keep in mind also that some of these companies are affected
by global conditions while others are mainly affected by domestic conditions. U.S. housing activity would mainly influence Countrywide and
Fannie Mae, while each of the brokerage firms also have international operations.
Evelina M. Tainer, Chief Economist, Econoday
| 