Note: Due to the holiday shortened week, Short Take will not be published next week. Have a great Thanksgiving!
Deflation is defined as a persistent decline in the general price level across all goods and services. Price declines in a selected number of goods or services do not signify deflation. One might think that falling prices would be positive for the economy. But consider that consumers may become reluctant to spend if they believe that prices are likely to decline. Without pricing power, firms have a hard time increasing profit margins. They need to reduce costs - and that could include reducing wages as well.
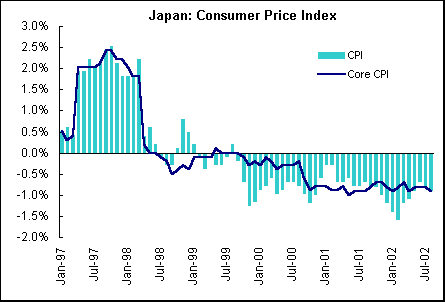
Recently some analysts have become concerned that the U.S. may follow Japan where deflation is a way of life. Conventional wisdom suggests that a deflationary environment would make it difficult for the Federal Reserve to conduct monetary policy. The Fed has direct control over the nominal federal funds rate but not the real (inflation-adjusted) rate which is equal to the nominal rate less the current inflation rate. If the inflation rate is negative, the Fed would have a more difficult time fine tuning monetary policy with the federal funds rate target - particularly if the federal funds rate target were zero.
This is essentially the Japanese problem: prices are falling and the bank rate is close to zero. Critics have long held that the Japanese monetary authority has moved too slowly and is unable to stimulate the economy properly. The aggressive action in early November was an attempt by the Federal Reserve to get in front of the curve.
While U.S. companies don't have much pricing power these days, the consumer price index, the most commonly used measure of inflation, indicates that the U.S. is not headed down a deflationary spiral.
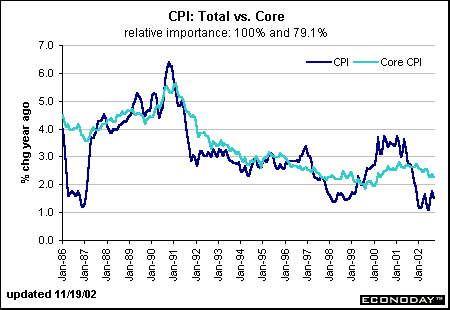
The chart above compares the total CPI with the core index, which excludes food and energy prices. Note that the core CPI fluctuates less dramatically than the total index, which is mainly reflecting oil price movements. The 1986-drop in the rate of inflation (also known as disinflation) was due to plunging oil prices. Similarly, the acceleration in the CPI in 1990-91 was due to the Persian Gulf War. The 1990s was generally associated with moderating inflation as the economy benefited by healthy gains in productivity, a vigilant Federal Reserve standing by ready to tighten credit conditions as needed, a competitive global environment, and great strides in technology.
Getting down and dirty with the data
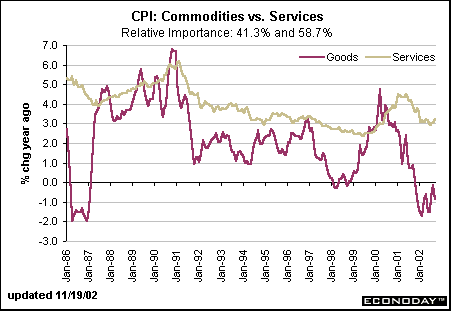
We all know that food and energy prices are more volatile than the rest of the CPI components. But these aren't the only components that are causing the CPI to fluctuate. The CPI has always incorporated both commodities (goods such as apparel, autos, gasoline and food) and services (services such as housing rent and public transportation services) within its index, although their relative importance has altered over time. For instance, 20 years ago the split between goods and services was roughly 50/50. The relative importance has shifted so that commodities account for a good deal less than half of the index today - exactly 41.3 percent. The remaining 58.7 percent is attributed to services. The distribution of goods and services plays a major role in determining whether inflation can quickly turn to deflation.
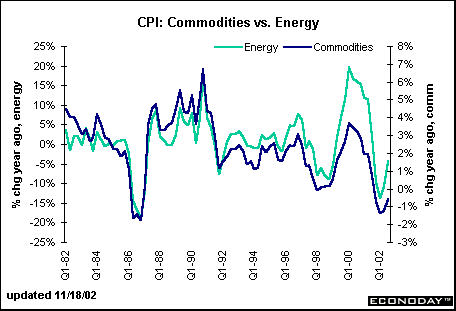
Commodity prices fluctuate within wide bands
Energy commodities account for 2.8 percent of the total CPI and less than 7 percent of the commodities portion. Yet they largely determine the direction of movement in the commodities CPI. Note the scale on the left axis ranges from -25 to +25 percent and corresponds to energy price changes over the past 20 years. Total commodity prices have ranged in a much narrower band; outright declines in the commodity CPI occurred only less than a handful of times in the past 20 years: Q2-Q486; Q198; and most recently Q401 to Q302. Each time, energy prices were an impetus behind the drop.
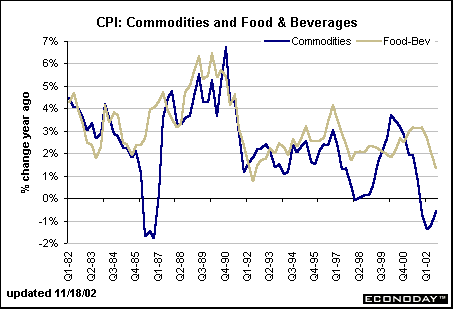
Food and beverage prices fluctuate sharply but not nearly as much as energy prices. In the past 20 years, yearly changes have ranged from +1 to +7 percent. Notice that food and beverage prices have not declined in any of the past 20 years, although a bit of disinflation (a slower rate of inflation) took place in the 1990s.
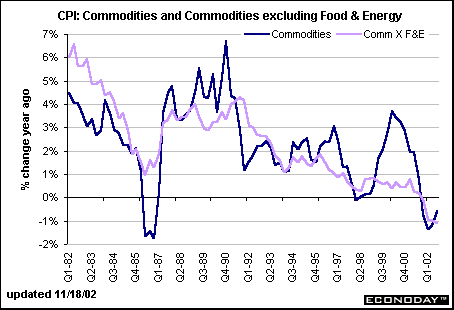
It is common to look at the total CPI excluding food and energy prices; the chart below compares CPI commodity prices to the commodities index excluding food and energy prices. Not surprisingly, the nonfood & nonenergy portion of the commodity price index is less volatile than the total commodity index. Also, it is interesting to note that we have seen outright declines in this index beginning Q4:01. The last time this particular index posted similar declines was in 1960.
Durable goods is the major component of the commodities index pushing down prices. Computers and other high tech gadgets fall under this category, along with cars and light trucks. It is useful to consider why computer and motor vehicle prices are falling so rapidly. There is no question that demand for cars and light trucks has dampened, compelling automakers to offer heavy incentives to boost sales. Consider normal economic conditions - prices of unwanted items are discounted to the point where demand is created. (If there is no demand for the particular item, then the price must be zero and it won't be produced anymore.) Computer prices have declined recently because the demand for computers has diminished after the capital spending boom of the 1990s. In addition, the cost of producing computers is coming down due to improved technological changes that have taken place over the past five years.
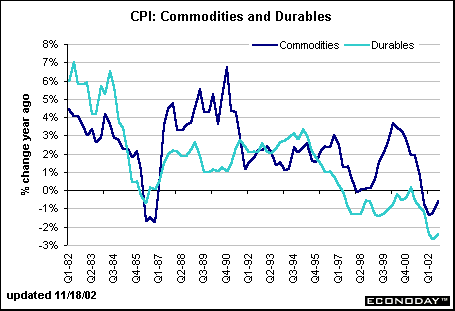
Also, changes in the methodology of the consumer price index have made it easier to incorporate life-cycle price changes of new products. Historically, the Bureau of Labor Statistics updated weights and products every 10 years. In the past five years, improvements in measurement have allowed a more rapid introduction of new products within the CPI. Thus, dramatic price changes in VCRs may not have been registered but high definition TVs (HDTV) may see their full life-cycle recorded in the CPI. Incidentally, durables make up 29 percent of the commodity price index but account for 12.1 percent of the total CPI.
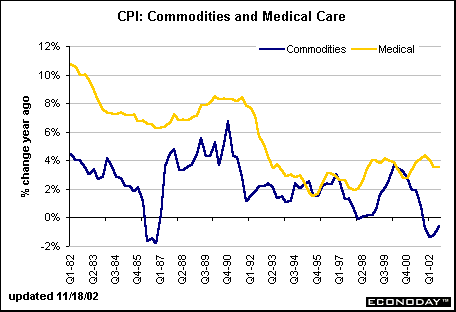
Medical care commodities (drugs, for instance) account for only 3.3 percent of the commodity price index and a mere 1.8 percent of the total CPI. Yet, despite the fact that medical care commodity prices have moderated in the 1990s, these prices are not in a declining mode these days. Rather, these costs have accelerated from their low point recorded in the fourth quarter of 1995.
Prices of services fluctuate in a narrow band
In the service sector, prices don't tend to decline. At least we haven't seen a drop in services prices in the consumer price index. The major components of the services index include: rent of shelter, transportation services, medical care services and other services. The single largest component is rent of shelter accounting for 31.2 percent of the total CPI and 53 percent of the services index. This index only goes back to 1991, but notice it has remained in a tight band these past ten years. The biggest moderation in inflation rates came from transportation services, but these appear to have hit their lows in 1999 and have since accelerated. Medical care services are the fastest growing component, similar to its commodities cousin.
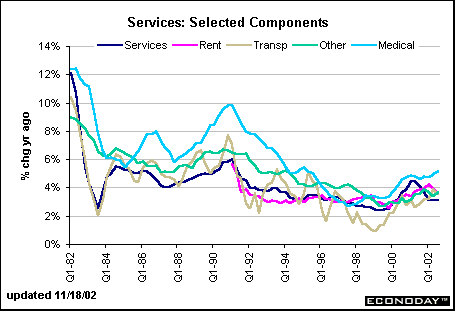
The question we need to ask ourselves at this point is where prices are headed. While rent of shelter appeared to moderate in the most recent quarter, all the other major components were headed higher, not lower. Given that the rent of shelter component is the largest, and thus has the greatest chance of shifting the course of the services index, it would be useful to monitor. If the housing market collapses, rent costs may perhaps drop. It isn't the best bet though.
BOTTOM LINE
Pundits loosely bandy about terms such as deflation when they see some commodity prices fall. In fact, the definition of deflation strictly looks at the general price level, not just some falling prices. Relative prices are shifting all the time in relation to the demand for particular goods and services, or the technology required to make these goods.
If producers must reduce prices to entice customers, maybe the products aren't priced correctly given current demand conditions. At the same time that American automakers were offering generous financing on their cars this past year, foreign makers selling cars in the U.S. didn't find the need to be quite as generous. And even among U.S. dealers, desirable cars were selling briskly without benefit of incentives.
Economics 101 teaches us that improving technology will create efficiencies that allow goods to be made more cheaply. Thus, it is normal to see prices drop for televisions, VCRs, DVD players, computers, PDAs, and communications equipment.
In order for the CPI to show a zero inflation rate (that's not falling prices, but stable prices), the commodities price index would have to decline 4.3 percent (based on the 3 percent upward trend in service index). That will be difficult to achieve when energy prices are rising. Don't be misled into thinking that energy prices are irrelevant to our inflation picture. Economists have talked about the core CPI - which excludes food and energy prices - because it is more stable on a month-to-month basis. However, there is nothing more core to consumers than buying gasoline, fuel oil and food.
By the way, the chart below depicts true deflation.
Evelina M. Tainer, Chief Economist, Econoday
| ![[Back To Archive]](../../../images/backtoarchive.gif)
