Many market players and media pundits have focused on the issue of consumer attitudes. As consumer confidence has declined over the past couple of years - most recently in October - equity investors have feared that consumer spending would follow suit. Yet, retail sales have mostly risen over this time frame, despite the fact that the U.S. economy was in recession. The National Bureau of Economic Research, the official arbiter of dating the business cycle, has not yet determined whether the economy has entered its recovery phase. Most economists believe the recovery began early in the year. In any case, market players shouldn't be as focused on consumer attitudes as they should on factors that actually impact consumer spending. First and foremost, that means jobs. If consumers are working and feel reasonably confident that their job is secure, then they will continue to spend the bulk of their earnings. (Savings remain minuscule though the savings rate has picked up in the past couple of years.)
Claims for Unemployment Insurance
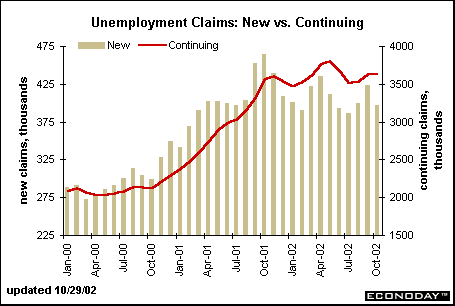
Weekly jobless claims have long been a favorite indicator to determine conditions in the labor market. The figures are reported weekly and revisions are usually moderate. Even after accounting for occasional problems with seasonal adjustment, the weekly figures are fairly reliable. Market players and economists tend to focus on the new claims figures, which are reported with only a 5-day lag. When more workers file new claims for unemployment insurance, it means of course that labor market conditions are generally weakening. A spurt in new layoffs bodes poorly for employment prospects. Certainly, workers are laid off even in the best of times. The chart below depicts the monthly levels of new jobless claims back to the beginning of 2000. Notice that jobless claims were running at roughly 275,000 per week during a relatively healthy period in early 2000. New jobless claims shot up to nearly 475,000 per week in October 2001. In the past year, new jobless claims have leveled off a bit but have hovered very near the 400,000 level - usually consistent with very little employment growth. In the first three weeks of October, new jobless claims have fallen from higher levels in September, but the downtrend is not yet convincing.

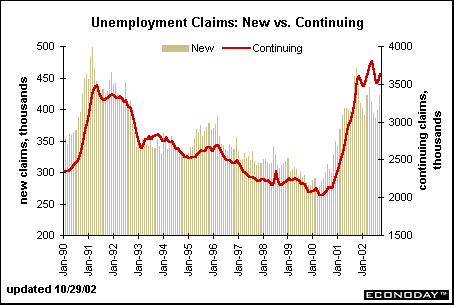
Continuing claims reflect those unemployed who still haven't found a job and are collecting benefits for a fixed period (usually 26 weeks). When labor market conditions worsen, it's harder for the unemployed to find a new job. Typically, as seen in the chart above, new and continuing claims tend to move in tandem. Notice that the level of continuing claims remained quite high through the first two weeks of October. (Continuing claims are reported with an extra week's delay over the new claims figures.) The chart below shows the behavior of new and continuing claims over the past twelve years. It is very interesting to note that while new jobless claims have not risen as much as they did in the previous recession (1990-91 period), continuing claims are actually higher now. While the lower level of new claims suggests that fewer workers may have filed for unemployment benefits this time around; the higher continuing claims figures suggest a lot more workers are having a harder time finding new jobs.

Household employment versus nonfarm payrolls
Monthly changes in employment are erratic. Data in both the establishment survey as well as the household survey can shift by large amounts during expansions and recessions. To make matters even more confusing, employment changes measured by the two surveys don't always move in tandem month-by-month. As market players are trying to determine whether labor market conditions have turned around, the focus on employment statistics has become more intense than usual.
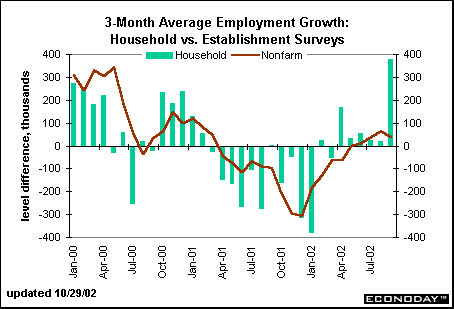
The chart below depicts a three-month moving average of the monthly changes in both nonfarm payrolls and household employment. Over the past three years, the two have generally moved in the same direction. However, the monthly changes are by no means equal in any given month. Most noticeable is a huge spurt in household employment in September that was not matched in the establishment survey. The household survey shows a slightly quicker improvement in employment than the establishment survey - turning around in February this year rather than May.

Given the problems with collecting statistical data in general, it is not necessarily appropriate to say that one survey is better than the other. Each has its own advantages and disadvantages. It is best to look at both measures of employment. Furthermore, it is best to compare the differences over three or four months, rather than just looking one month's figures.
Rates and Ratios
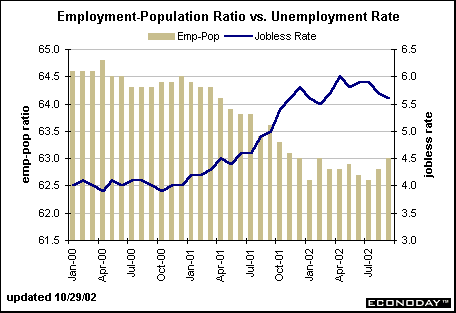
It is common to look at monthly changes in nonfarm payrolls, but it is not common to look at the household employment data in the same way. Actually, the household survey is conventionally known for its statistics on the civilian unemployment rate and the employment-to-population ratio. Not surprisingly, the employment-to-population ratio is inversely related to the jobless rate. When one falls, the other rises and vice versa. The jobless rate peaked at 6 percent in April. It isn't unusual to see the unemployment rate rise during the early stages of an economic recovery because discouraged workers, who had dropped out, re-enter the labor force when chances of finding a job improve. At some point, the rise in the labor force levels off and the unemployment rate eventually begins to decline as employment rises and the number of unemployed fall. This time, the unemployment rate didn't rise as rapidly as many economists had predicted; although economists are looking for a higher unemployment rate this coming Friday.
The employment-to-population ratio rose in August and September, but remains near the cycle low of 62.6. Since formerly discouraged workers may be re-entering the labor force and lifting the jobless rate temporarily during a recovery, one would expect the employment-to-population ratio to start rising before the unemployment rate falls. In fact, that has not been the case in this cycle, although it was true in the 1990-92 period. This could be among the reasons that many economists are not convinced the declining unemployment rate is truly reflecting an improving labor market.

BOTTOM LINE
Market players will continue to focus on labor market indicators in the next couple of months. This coming Thursday, market players will get a preview of labor market activity when the new and continuing jobless claims are released. A downward trend in new and continuing claims would bode well for the employment situation.
On Friday, November 1, all eyes will be on the October employment report. The market consensus is not very bullish on labor market conditions. Nonfarm payrolls are expected to inch up a measly 25,000 during the month (consider 250,000 reasonable for a recovery); the unemployment rate is predicted to rise 0.2 percentage points to 5.8 percent. Make sure to also follow the employment-to-population ratio for October. Even if the jobless rate rises due to faster labor force growth, the employment ratio could rise if the number of employed workers makes a decent gain.
October's plunge in the Conference Board's consumer confidence index has renewed the fervor among those market players calling for a Fed rate cut this year. If the employment data are consistently anemic, the rate-cut camp will probably gain ground on Friday. However, if the employment statistics show some improvement, the rate cut zealots will have less to stand on - at least in advance of the Nov. 6 FOMC meeting.
Evelina M. Tainer, Chief Economist, Econoday
| ![[Back To Archive]](../../../images/backtoarchive.gif)
