The employment situation for August will be reported early Friday morning. Market players are looking for a modest drop in nonfarm
payrolls of roughly 35,000 coupled with a slight uptick in the unemployment rate to 4.6 percent from 4.5 percent in July. If nonfarm payrolls
decline in August, it would be the third straight drop and the fourth drop in five months. Given that equity investors are hoping to see some
signs of economic growth that could potentially lead to profits, a decline smaller than the consensus, or an outright gain in nonfarm payroll
employment for August would likely be a favorable development and could lead to increases in stock prices. Conversely, if nonfarm
payrolls decline more than expected, stock prices would likely drop because investors would believe that the economic recovery would be
long in coming.
Chances are good, though, that whether payrolls decline more than expected, or less than expected, that market volatility is going to be
high on employment day. Stock market movement was relatively mild on June 1st and July 3rd since actual data were in line with
expectations, but the major stock indices posted larger-than-average changes on most of the employment days this year.
| |
Daily Change
1999-2001 |
Employment Day
1999-2001 |
|
| Dow |
0.9% |
1.3% |
|
| S&P |
1.0% |
1.5% |
|
| Nasdaq |
2.0% |
2.6% |
|
| Russell |
1.1% |
1.5% |
|
| Wilshire |
1.0% |
1.5% |
|
The table above compares the average daily change (the absolute change whether it is positive or negative) for each of the key stock
market indices relative to the average change on the day in which employment was reported. In every case, the average change on
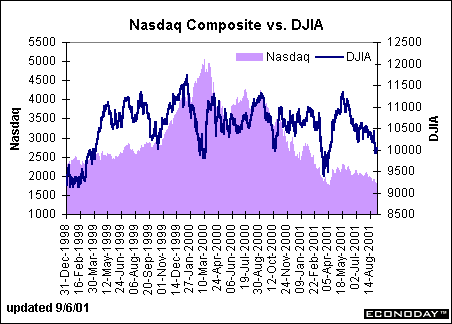
employment day was larger than the average daily change in the stock market. Look at the chart below. Notice the high degree of daily
volatility. Market fluctuations were due to a variety of factors including Fed policy changes, and financial global crises (which tends to
generate flows of funds towards U.S. markets). Also keep in mind that the Fed raised the federal funds rate target in 1999 and 2000 and
then lowered its target in 2001. Each time the Fed makes a change, stock prices tend toward larger market fluctuations. Yet, we were still
able to find that employment day generates significantly higher market variation.

The bottom line?The table below shows how the various stock indices moved on each of the employment reports in 2001. Based on
historical experience, you can bet that fluctuations are going to be wide on employment day. Incidentally, we only have data that shows
how much stock prices have fluctuated from one day to the next. Most of the time, the widest fluctuations take place within 15 minutes after
the number is reported. Investors beware.
| Stock Market Change on Employment Day 2001
|
| |
Jan-01 |
Feb-01 |
Mar-01 |
Apr-01 |
May-01 |
Jun-01 |
Jul-01 |
| DJIA |
-1.1% |
-2.0% |
-1.3% |
1.4% |
0.7% |
-2.2% |
-0.4% |
| Nasdaq |
-4.4% |
-5.3% |
-3.6% |
2.1% |
1.8% |
-3.7% |
-1.0% |
| S&P 500 |
-1.7% |
-2.3% |
-2.0% |
1.4% |
0.4% |
-2.3% |
-0.5% |
| Russell |
-1.6% |
-1.6% |
-2.3% |
1.5% |
1.1% |
-1.9% |
-0.4% |
| Consensus = Actual? |
no |
no |
no |
no |
yes |
no |
yes |
| |
|
|
|
|
|
|
|
Evelina M. Tainer, Chief Economist, Econoday
Legal Notices | © 2001-2002 Econoday, Inc. All Rights Reserved.
|
