Nonfarm payroll employment has declined in two of the past three months. Except for a back-to-back decline last year when Census workers came off payrolls, nonfarm employment hasn't fallen two straight months since the end of the 1990-91 recession. Economists and policymakers consider employment as an indicator of recession. A one or two month dip doesn't necessarily mean a downturn, but we may see more declines going forward.
Household employment, which is used in the calculation of the civilian unemployment rate, has actually shown more weakness in the past several months. The unemployment rate has increased from a low of 3.9 percent in September and October 2000 to a high of 4.5 percent in June 2001. A closer look at household employment relative to nonfarm payrolls shows a big discrepancy between the two series in recent years.

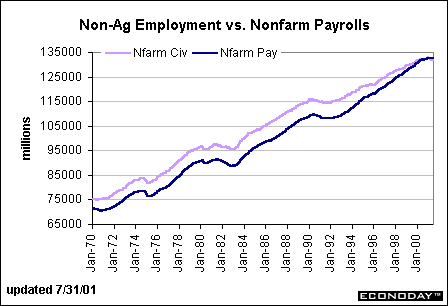
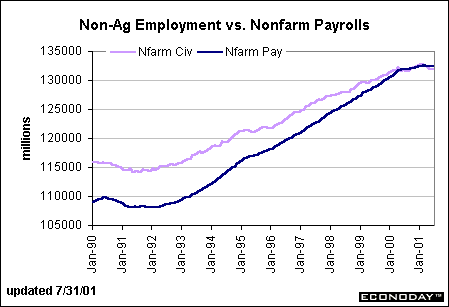
This first chart compares household employment in the non-agricultural sector to nonfarm payrolls from the establishment survey. Total household employment also includes farm jobs, but we remove these from the series to make the two measures more comparable. Going back 30 years, you see that a rather consistent gap exists between household employment and nonfarm payrolls. At least part of this difference is due to the fact that household employment also includes the self-employed, workers who are not counted in the establishment survey. Also, family members working in a family-owned business are counted as employed even if they don't earn a salary. Since they're not on a payroll, though, they don't show up in the establishment survey. Notice that the gap between these two employment measures narrowed in the 1990s and disappeared entirely in 2000. The chart below looks only at data since 1990 to get a better view of the narrowing gap. By 2001, the level of employment measured by nonfarm payrolls surpasses the level of employment measured in the household survey.

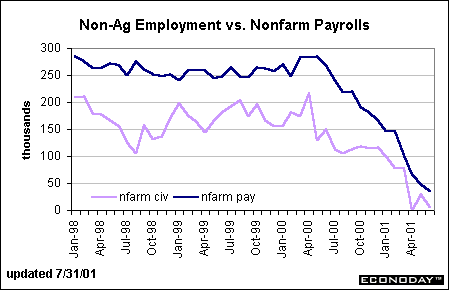
The chart below looks at a 12-month moving average growth rate in household employment and nonfarm payrolls. Notice how average monthly growth is much higher for nonfarm payrolls (ranging from 250,000 to 300,000 per month) than for non-ag household employment (ranging from 100,000 to 200,000 per month) through about April 2000. The impact of temporary Census workers played havoc with the trend in mid-2000, but there is no question that both series fell off a cliff in the summer of 2000 in terms of their growth rate. Through June 2001, the decline in household employment is more dramatic than the drop in nonfarm payrolls.

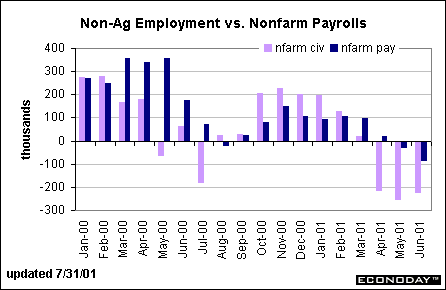
The final chart below shows 3-month moving averages of nonfarm payrolls and non-agriculture household employment. Nonfarm payrolls have grown faster over the past 18 months and haven't declined as much in the past six months. Since household employment measures whether someone has a job or not, and nonfarm payrolls measures the number of jobs, the two series can vary from time to time as they are now. At some point in the near future, we may see greater declines in nonfarm payrolls as large numbers of jobs are eliminated. Some of the workers in these jobs may be multiple job holders who haven't become totally unemployed. At this point, then, the declines in household employment may be mitigated and the unemployment rate itself may increase at a slower rate.

The employment situation for July will be reported on Friday. Economists are predicting that nonfarm payrolls will decline by roughly 50,000 for the month and the civilian unemployment rate will edge up to 4.6 percent in July.
Evelina M. Tainer, Chief Economist, Econoday
| 