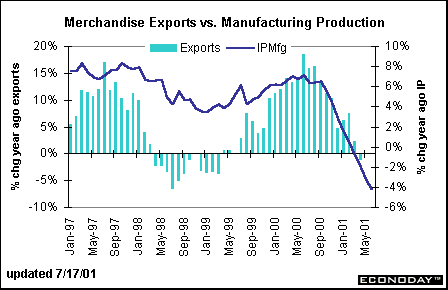
The index of industrial production declined for the ninth straight month in June, putting total production 3.6 percent below year ago levels. The number of monthly declines has surpassed the 1990-91 recession, making it the worst period since the 1981-82 recession. Several factors are contributing to the weakness in the industrial sector. For instance, excess capacity is hurting the sector, the result of dramatic gains in capital spending during the late 1990s. Many analysts are pointing to the strong dollar as a negative factor in corporate profitability. The strong dollar is also depressing export demand. The chart below compares the annual growth in merchandise exports and manufacturing production. Notice how well the sharp drop-off in production correlates with the decline in export growth! Manufacturing production was down 4.2 percent from year ago levels in June. The international trade balance on goods and services for May will be reported on Thursday, and chances are good that exports probably declined further.
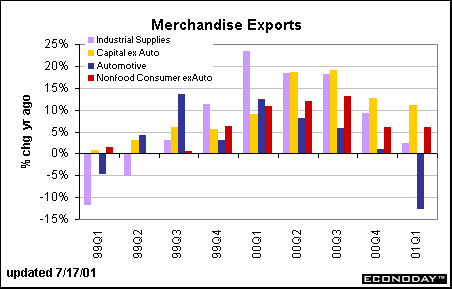
In the first quarter of 2001 auto exports dropped sharply, suffering the most of any category. This corresponds with production figures that showed substantial weakness in the first quarter. But second quarter motor vehicle production improved and this may show up in the export figures for the second quarter as well. Industrial supplies are still showing year-over-year gains, but notice that the pace of growth has decreased from more than 20 percent in the first quarter of 2000 to less than 5 percent in the first quarter of 2001. Exports of non-auto capital goods as well as non-auto, non-food consumer goods are still showing year-over-year gains, but both have moderated significantly.
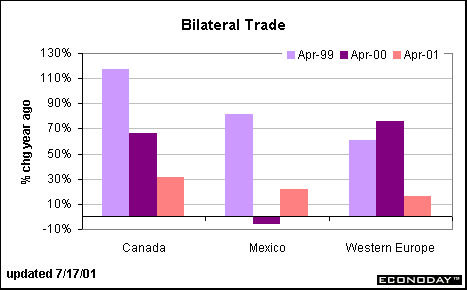
The two charts below depict annual changes in bilateral trade balances with various countries. In all cases, the U.S. is running a trade deficit, with increases in the graph reflecting a larger deficit relative to a year ago and declines a smaller deficit. The changes show the cumulative bilateral trade balances from January to April. Our trade deficit with Canada, Mexico and Western Europe continued to grow in the first four months of 2001 compared with a year ago, though at a slower pace.
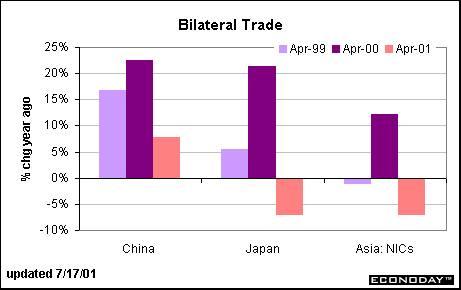
The U.S. trade deficit with China is also growing, albeit at a slower rate than the past two years. Nevertheless, this has been the fastest growing bilateral trade deficit in recent years. In 2000, China surpassed Japan as the nation enjoying the largest trade surplus with the United States. But through the month of April, China and Japan were running neck and neck in terms of their U.S. trade balances, though the U.S.-Japanese trade deficit is now narrowing. The U.S. trade deficit with NICs (newly industrialized countries) also is narrowing.
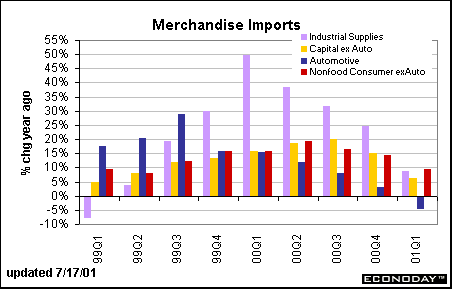
The international trade balance on goods and services for May will be reported on Thursday. The market consensus forecast is looking for the trade deficit to remain roughly unchanged at $32 billion. The trade balance peaked last September at $34.5 billion. To some extent, the deficit has narrowed because crude oil prices have declined. But import growth has moderated substantially as demand for capital goods and industrial supplies has fallen sharply in the past year. The chart below shows yearly growth in merchandise imports. While demand for U.S. exports has weakened because of a stronger dollar and softening economies overseas, U.S. demand for imports has decreased because of economic weakness here. While import demand helped to satisfy excess consumer and business demand when economic growth was surging, a slower pace of imports now helps limit the damage to the domestic economy.
Evelina M. Tainer, Chief Economist, Econoday
| 