Investors are often left wondering which indices to check to determine the state of the equity market. Many go to the Dow Jones Industrial Average but aren't convinced that 30 top companies, however carefully selected, can be representative of the entire stock market. The NASDAQ composite index incorporates over 4000 major companies, but this index has a well-deserved reputation of focusing on the technology sector. This leaves the Standard & Poor's 500-index as the comprehensive measure for the equity market.
The S&P 500 often mirrors the Fortune 500, though there are a significant number of companies that fall outside. Investors are advised to look into several indices that Standard & Poor's also tracks. Three major indices that cover different sized companies include the S&P MidCap 400, the S&P SmallCap 600, and the S&P 100.
The S&P MidCap 400
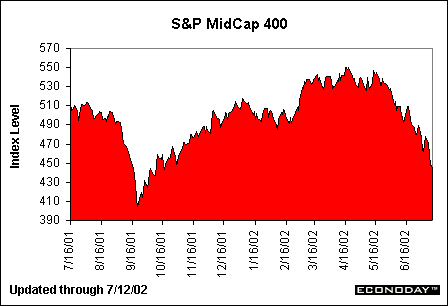
The S&P MidCap 400 is an equity index comprised of 400 domestic stocks. This index is designed to represent growth stocks and value stocks. Equities included in this index are determined by market size, liquidity, and industry group representation. The index is market-value weighted and was the first benchmark in the market capitalization stock price movement. Used by 95 percent of U.S. fund managers and pension-plan sponsors, the index is typically included among 401(k) options. Over $25 billion is indexed in the S&P MidCap 400.

Evident in the chart above, the S&P MidCap 400 has performed quite similarly to major indices over the past year. The big drop following September 11th was followed by substantial recovery. But recent weakness in large capitalization stocks has also bled mid-cap stocks, themselves not immune to suspicion over accounting tricks.
The S&P SmallCap 600
This index is comprised of 600 domestic companies with smaller capitalization than major and mid-cap companies. The SmallCap 600 is akin to the Russell 2000 index of small cap stocks. Components of the 600 are selected in the same manner as the S&P MidCap 400: by market size, liquidity, and industry group representation. Each stock represented in this small-cap index is weighted in proportion to its market value. The index has become the preferred benchmark for both active and passive fund managers due to its low turnover and greater liquidity. Over $8 billion is indexed to the S&P SmallCap 600.
On a side note, the S&P SmallCap 600 is added to the S&P 500 and the S&P MidCap 400 to make up another index that Standard & Poor's tracks -- the S&P SuperComp 1500. This large combination represents 87 percent of the total U.S. equity market capitalization.
The S&P 100
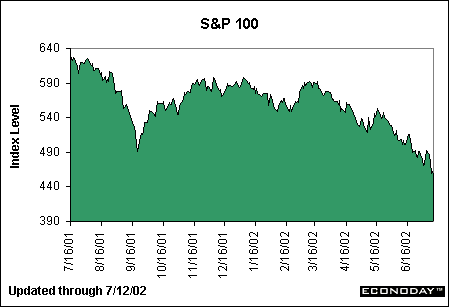
The S&P 100 index is a narrower index, closely related to the S&P 500 index. Because it measures large company U.S. stock market performers, the S&P 100 typically consists of the 100 best-performing stocks on the S&P 500. The index is still a market capitalization-weighted index, but it measures 100 major blue-chip stocks across diverse industrial groups. The 100 is good for those who want a blue-chip index that encompasses more companies than the DJIA.

The chart above shows that major blue chips in the S&P 100 index have suffered the same trouble that the entire equity market has experienced in the past year. It is interesting to note, however, that the S&P 100 has now sunk below levels reached after the September 11th tragedy. In the earlier chart, we saw the MidCap 400 index simply approaching its September levels. This evidence highlights the fact that major blue-chip companies have been more affected by the accounting scandal than smaller companies, although the negative effect is dragging across equity indices.
Why should investors care?
Investors tend to follow changes in the Dow Jones Industrial Average or the NASDAQ composite. Individual investors may have blue chip or high tech stocks, but chances are good that their portfolio is diversified in such a way that the S&P 500 might be a better benchmark to use.
The negative energy in the equity markets cannot continue forever. Investors should be looking for any potential signs of a stock-price rebound. There is a strong likelihood that mid-cap and small-cap companies may experience gains before blue chips do. Investors will benefit by paying attention to the S&P MidCap 400 and S&P SmallCap 600 to get a better idea how smaller companies are being affected by the economic climate.
Damir Fonovich, Market Analyst, Econoday
| ![[Back To Archive]](../../../images/backtoarchive.gif)
