Every Wednesday the Mortgage Bankers' Association reports its weekly activity status on home purchase applications, which is considered a leading indicator of home sales and housing starts. How closely does this index correlate with housing activity? Should investors pay close attention to the weekly figures?
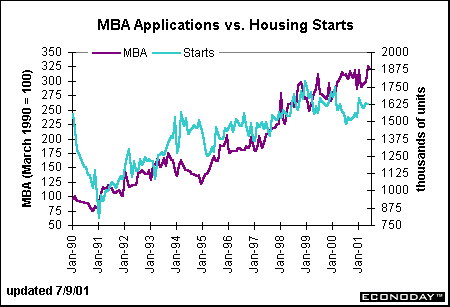
The chart below compares the purchase applications index to monthly housing starts. We have converted the weekly index to a monthly average. Notice that broad movements in housing starts are generally captured by the MBA index. However, housing starts increased dramatically in 1994 even as the applications index declined during the period. In 2000, housing starts declined while the purchase index continued higher.

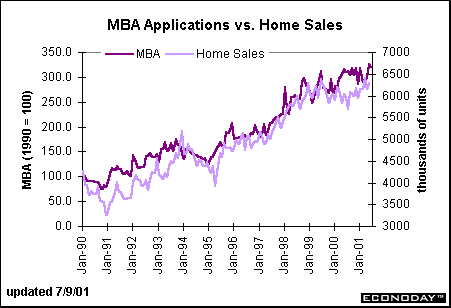
The chart below depicts the purchase applications index relative to (new and existing) home sales. It appears that home sales are more closely related to the MBA purchase index than housing starts. That's not entirely surprising given that the index actually measures purchase applications - not housing permits. While the 1994 period does not show the same discrepancy as in the housing starts chart, there is a similar pattern for the year 2000. The purchase applications index climbed even as home sales declined. In 2001, home sales have begun to pick up steam while the purchase applications index is on a rising trend.

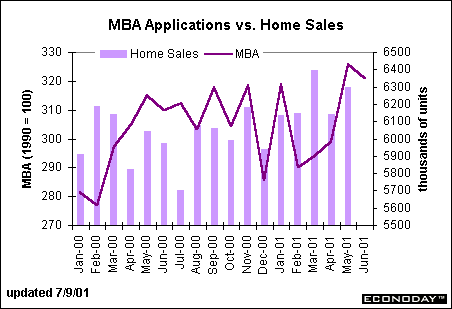
Historically, one could follow the rule of thumb that increases in the MBA applications index lead home sales by 3 to 4 months. But if you look at the monthly figures for the past 18 months, you won't find a discernable pattern. Perhaps this is because the timeframe for both series is too narrow.

On a monthly basis, the purchase index hit a new high in May. On a weekly basis, the applications index peaked in the week ending June 1 but has subsequently declined. It will be interesting to see whether the downward pattern in this index persists in July and August. If the index heads lower on a consistent basis, it would point to lower home sales in coming months.
It is true that mortgage rates are down from year ago levels, but they bottomed out in the first quarter of this year. Since mortgage rates are closely related to market rates such as yields on 10-year Treasury notes, they still have yet to benefit from about half of the 275 basis point drop in the federal funds rate target. (Yields on 10-year Treasury notes and 30-year Treasury bonds have increased in the past couple of months despite the Fed's rate cuts because bond investors have become more concerned about the potential for inflationary pressures.) With the unemployment rate headed higher and income growth anemic, it is possible that the housing market may indeed moderate in coming months despite the Fed's aggressive easing over the past six months.
Evelina M. Tainer, Chief Economist, Econoday
| 