| ||||||||||||
|
| ||||||||||||
![[Back To Archive]](../../../images/backtoarchive.gif)
| ||||||||||||

|
|||||||||||||||
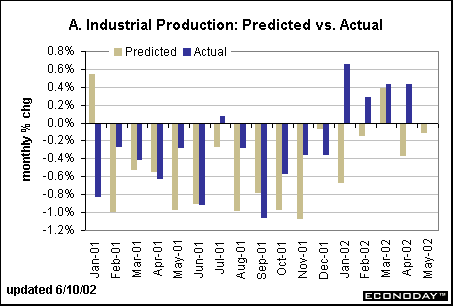
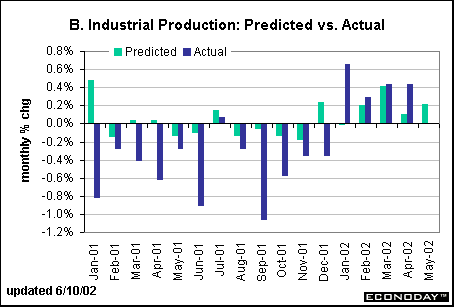
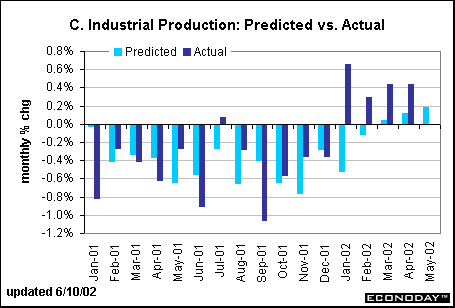
Economists weren’t too happy with last week’s employment report. It set the tone for what will likely be soggy economic figures all month long. We’ve made that claim before – that the employment report is often out in front of other economic indicators. Why is this? Partly, the employment statistics are one measure of production in the economy. In fact, one can use the employment report to actually predict the index of industrial production, which is reported seven to 10 days later. No Frill Approach When I was an economic forecaster, I made a practice of using several models to predict the same variable. Economic modeling isn’t perfect and the same model doesn’t work all the time. Moreover, it is useful to see what the range of results might be. For industrial production, three models give a fairly good estimate for the month. The chart below is the no frills method. It basically uses factory payrolls and the factory workweek without applying fancy statistical models. Multiply the level of payrolls with the average manufacturing workweek to get total manufacturing hours worked. Then compare the percent change in hours worked with the previous month. This should correspond to the change in industrial production. Aside from very big misses in January 2001 and January 2002 when this approach predicted the wrong sign by a substantial magnitude, most of the time it gives the general direction. One of the problems is that this method doesn’t account for even-trend productivity.  Using Statistical Methods Our first foray into statistical modeling uses exactly the same variables as before (factory workweek and payrolls) and in the same fashion. Using simple regression techniques, our independent variable is total person-hours in manufacturing. A constant is also applied, serving as the productivity variable. (Regression analysis identifies relationships between two or more series systematically.) The chart below, which compares the predicted values to the actual production figures, is almost worse than the simple no frills approach. It is true that the predicted values are pretty good over the past few months, but they are not very good for a major portion of the 18-month period. One of the problems is that we are assuming that employment and hours worked carry the same importance in the equation. In fact, they don’t.  Running another regression where the percent change in employment and the percent change in the workweek are listed separately yields a different and better equation. The chart below shows that the equation does a pretty good job of predicting production, except for January 2002, a turning point in this series.  The Bottom LinePredicting economic variables is harder than it looks even when using good statistical models. It is important to rely on more than one model as a model's accuracy changes at different times of the business cycle. For instance, Model B (the middle chart) seemed to perform better at the turning point early in January and seemed to have done a better job of predicting production in the first part of the year. However, model C was better during most of the downturn in 2001. It is important to keep in mind that these are simplistic models for predicting industrial production. We are only looking at the manufacturing sector here. Total production also includes utilities and mining. When the weather is different from normal seasonal patterns, utilities can have perverse monthly effects on production changes. Understandably, economists often monitor trends in electrical usage. So what are the models telling us for Friday’s industrial production report? The no frills model (A) suggests that production will post a drop of 0.1 percent. Models (B) and (C) both predict a rise of 0.2 percent. The consensus forecast is calling for a rise of 0.3 percent with a range of 0.1 to 0.5 percent. Six of the 18 forecasters in Market News International's survey are calling for a 0.2 percent hike. If I were making the forecast, I would probably ignore model (A) and go with a 0.2 percent hike as indicated by the other two models. | |||||||||||||||