| ||||||||||||
|
| ||||||||||||
![[Back To Archive]](../../../images/backtoarchive.gif)
| ||||||||||||
 | |||||||||||||
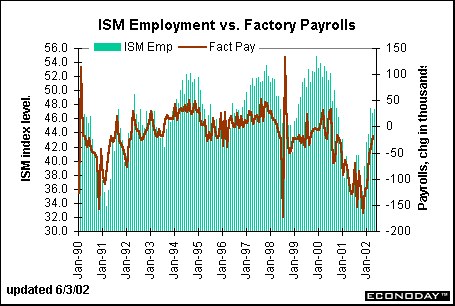
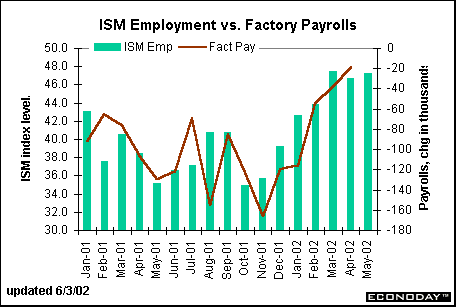
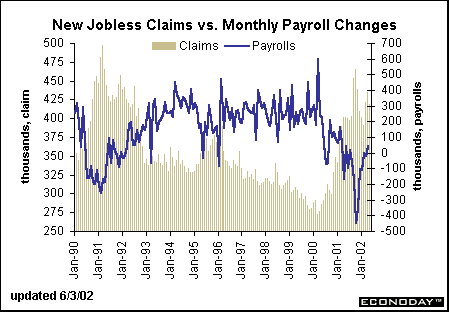
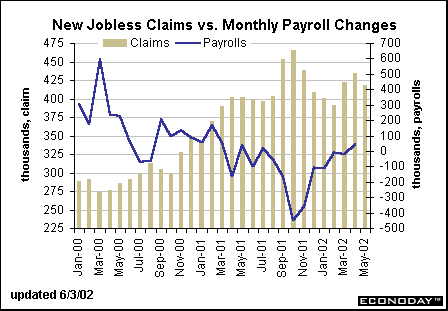
Rich with information, the employment situation ranks high on the list of economists’ favorite indicators. Market players react strongly to the employment report because they know it usually sets the tone for the month’s set of indicators. Moreover, it is one of the timeliest of monthly indicators. Economists use the employment report to predict a variety of data such as industrial production, personal income and GDP. But what about predicting employment? What variables do economists study to fashion a forecast for nonfarm payrolls? ISM Manufacturing Index Most of the time the ISM manufacturing index is released several days in advance of the employment situation, although the lag between the two reports can be slim. The ISM manufacturing index is comprised of many components, one of which is employment. This measure relates specifically to the employment report's factory payrolls data. Notice that factory payrolls move in tandem with the ISM employment index, aside from a plunge/spike in 1998 related to an auto strike.  Keep in mind that any level above 50 in the ISM indexes reflects increases and any level below 50 reflects declines. The chart below zeros in on recent month-to-month movements between the ISM employment index and factory payrolls. The index has averaged about 47 over the past three months – including the most recent month of May. In March and April when the index was near 47, factory payrolls posted declines of 38,000 and 19,000 respectively. Since the index remained below 50 in May, it is likely that factory payrolls will record a decline once again, perhaps in the same magnitude as the past month. This corresponds to economists’ consensus forecast of a 15,000 drop for the month.  New Jobless Claims For total employment, however, the ISM employment index would be a misleading indicator as manufacturing employment accounts for only 13 percent of total nonfarm payrolls. Historically, new jobless claims have done a good job of showing the general direction of nonfarm payroll employment. The two series are inversely related since a rise in new jobless claims tends to signal lower employment. As evident in the chart below, when new jobless claims approach 450,000 to 500,000 per week, then nonfarm payrolls tend to drop by 100,000 to 500,000 per month (with an average monthly drop of 300,000).  When new weekly claims approach the 400,000 level, nonfarm payroll employment starts to post increases. Judging from the chart above, jobless claim levels around 375,000 to 400,000 per week tend to generate monthly payroll gains of about 100,000. When new claims are consistently running near 350,000, monthly payroll increases are generally above 200,000. New jobless claims averaged 419,000 for the month of May. This level is typically associated with only a minor gain in payrolls. Indeed, the consensus forecast is looking for a 50,000 increase in Friday’s report. (Note: Special factors affect the forecasts. In May, new jobless claims were artificially inflated by a federal program that allowed workers, who had not yet found jobs, to refile their claims. This could mean that new claims were really lower for the month of May and that the rise in nonfarm payrolls may be a bit higher than otherwise indicated.)  The Bottom Line The ISM employment index can be used to help predict monthly changes in factory payrolls. Since manufacturing employment has become such a small portion of total employment, economists need other indicators to predict overall employment changes. New jobless claims and nonfarm payrolls tend to mirror each other. It is important to keep in mind that any single weekly claims figure is not going to predict nonfarm payrolls, but the historical relationship is sound. Predicting nonfarm payrolls would be easy if economists simply had to look at claims and the ISM employment index. Special factors must be taken into account each month. For instance, strike activity, which might not be evident in claims or the ISM index, could affect payroll data. Also, seasonal adjustment factors aren’t perfect and these need to be taken into account as well. Nevertheless, monitoring these two indicators can go a long way in helping predict the direction of nonfarm payroll data. | |||||||||||||