|
Deciphering weekly retail sales
How well can the BTM index predict monthly retail sales?
The BTM same-store sales index rose 0.1 percent in the week ended April 7 relative to the previous week. However, the index was down 1.5 percent relative to the four-week average for March. This implies that retail sales started April on a weak note. But one should question whether this weekly retail sales index does a very good job of predicting the Commerce Department's monthly retail sales report.
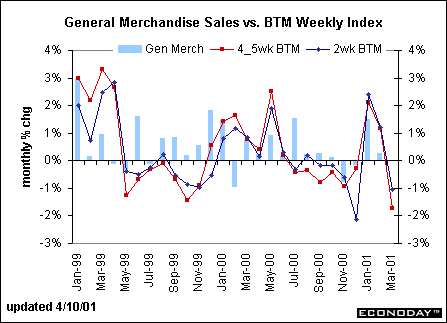
The chart below depicts monthly changes in the general merchandise component of retail sales (which consists primarily of department stores) and compares these changes to the weekly BTM index. We have derived two versions of the BTM series. First, we look at two weeks worth of data for each month relative to the previous month's average; then, we look at the entire month's average of the BTM index (either four or five weeks). Not surprisingly, the two BTM series move in tandem - although the first two weeks of the month can overstate or understate what the entire month's BTM index suggests. For instance, in March, the first two weeks of the month showed a 1.2 percent drop in same-store sales, but the four-five week index declined 1.7 percent. We won't know which is closer to the truth until the March retail sales report is released on April 12.

Why did we compare the BTM index to the general merchandise portion of retail sales and not total retail sales? It allows us to compare the same type of sales. The BTM index essentially is measuring retail spending at department stores, not spending at auto dealerships, furniture stores, or grocery stores and gas stations. The correlation between general merchandise sales only and the monthly BTM index was just 19.9 percent in the 1990s, though this correlation improved in the past couple of years to 32.6 percent. This means that there is a one in three chance that the monthly change in the BTM index will correspond to a similar monthly change in general merchandise sales. The correlation represents not only the direction of change, but also the magnitude of change. If we relax the statistical property and only look at the direction of the change (but not the magnitude), then the BTM index and general merchandise sales moved together 55.6 percent of the time in the past couple of years.
Compared with total sales, objective statistical tests reveals that the correlation between the monthly BTM index and total retail sales was 19.5 percent during the 1990s. Incidentally, the relationship deteriorated in the second half of the '90s, as the correlation between retail sales and the BTM index was 27.5 percent in the first half of the decade. As much credence as market participants often give to the weekly figures, this correlation is on the low side.
What can we surmise about March retail sales to be released Thursday? The consensus forecast of Wall Street economists is looking for a 0.1 percent rise in total sales and a 0.2 percent gain in non-auto retail sales. The general merchandise component accounts for roughly 13 percent of retail sales. The BTM index suggests there is a one in three chance that general merchandise sales will fall about 1.5 percent and nearly a two in three chance they will at least post a decline for the month. This certainly may be contributing to the anemic retail sales figures predicted by economists.
Evelina M. Tainer, Chief Economist, Econoday
|