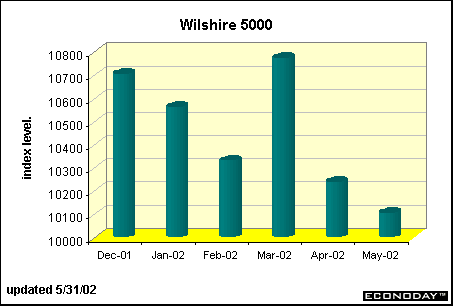
Recap of US MarketsThe trend is not our friendIn the five months of this year, March was the only good month for the equity market. May was another negative month, continuing a general downward trend in the stock market as measured by the Wilshire 5000 index depicted in the chart below. The Wilshire 5000 encompasses the entire stock market. The trend noted here for this specific index can be repeated for the Dow Jones Industrial Average, the S&P 500 and the Nasdaq composite. 
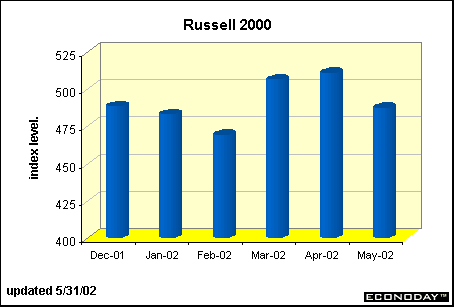
In sharp contrast to the general market stands the Russell 2000. Small cap stocks did get hit hard in May, but the trend for the small cap sector has been favorable since the beginning of the year. Small cap stocks often outperform the market in the early stages of recovery because these stocks are often hit the hardest during a downturn. 
Yield blip corresponds to stocksLooking at the yield on the 2-year Treasury note in the same fashion as the stock indices (on a month-end basis), one sees a mirror image. Initially, yields were low and stable even as stock prices started to tumble. But in March, the moment when the stock market staged a rally, the yield on the 2-year note spurted as bond investors believe that the Fed would soon start to raise rates. As the stock market has crumbled in the past two months, yields have come down from their highs. Still the 2-year note yield at the end of April and May was higher than for January and February when stock prices were higher. Earlier this year stock investors appeared more optimistic about the economic recovery than economists and bond investors. In the past few months, bond investors have reacted to relatively strong economic data, but higher yields have been limited by investors’ need for a safe haven due to political tensions and the soggy stock market. 
|
![[Back To Archive]](../../../images/backtoarchive.gif)