
Indicator scoreboard
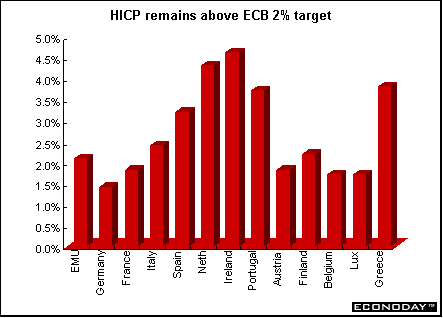
EMU - September harmonized index of consumer prices rose 0.3 percent and 2.1 percent when compared with last year. Core inflation excluding energy, food, alcohol and tobacco rose 0.3 percent and 2.4 percent on the year. Both the core and total index remain above the ECB target inflation ceiling of 2.0 percent. The rise in HICP was caused mainly by higher prices for clothing, education and energy. Prices fell for hotel and restaurant costs, recreation and culture goods as well as health care.
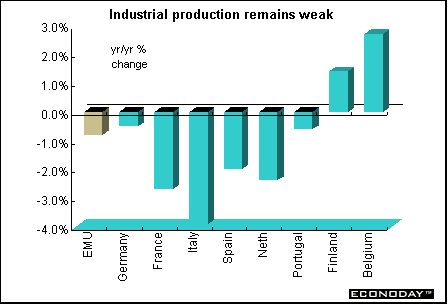
August seasonally adjusted industrial output rose 0.6 percent but is down 0.8 percent when compared with last year. Output rose in non-durable consumer goods, intermediate goods and capital goods. Output fell in energy and durable consumer goods.
Germany - October ZEW economic expectations index among German financial experts fell sharply for Germany and the eurozone indicating that the economic outlook in 2003 has become significantly bleaker. The German expectations index fell 16.1 points to 23.4. The October decline was the fourth in a row and brought expectations to their lowest level since November 2001. The eurozone expectations index fell 8.7 points to 34.4, also the fourth decline in a row and the lowest since Dec. 2001. Views on current conditions in both Germany and the eurozone also dropped in October, deepening the sense of economic gloom.
September wholesale price index jumped 0.9 percent due to higher prices for oil and seasonal food products. On the year, the WPI rose 0.3 percent. Seasonal food prices (fresh fruit and vegetables) led the increases. Excluding seasonal food prices, wholesale prices rose 0.6 percent and 0.1 percent on the year. Excluding oil products, wholesale prices rose 0.5 percent and 0.1 percent on the year.
August seasonally and workday adjusted manufacturing orders were revised down to an increase of 1.2 percent from the 1.7 percent gain originally reported. Domestic orders were revised down sharply to an increase of 0.3 percent from the original 1.1 percent. Foreign orders were revised down marginally to a 2.4 percent increase from the originally reported 2.6 percent. This followed foreign demand declines of 1.5 percent in July and 7.4 percent in June. The German Finance Ministry said the sharp rise in foreign demand was due to two large aerospace orders received during the month.
France - August seasonally and workday adjusted manufacturing output jumped 0.5 percent after dropping 0.7 percent in July. All manufacturing segments rose, led by autos and capital goods. In the past, Insee, the French statistical agency, has released industry results for July and August together as a single period. Obliged to follow EU standards this year, the Institute has attempted to adjust each month's results separately for seasonal variations without the necessary long-term back data. Many French firms reduce output or shut down entirely for part of the summer. But the 35-hour week is changing traditional vacation schedules, making the statistical adjustments less reliable.
Italy - August seasonally and workday adjusted industrial production rose 0.5 percent but is 3.9 percent below a year ago. ISTAT, the Italian statistical agency, pointed out that the workday adjusted year-on-year index has now posted 14 consecutive declines. Consumer goods' output and output of investment goods increased while intermediate goods fell
August world merchandise trade surplus was €1.415 billion, about the same as the surplus of €1.436 billion in August 2001. Imports from the rest of the world rose 1.1 percent, while exports rose 0.9 percent. Merchandise trade with the EU posted a deficit of €585 million compared with a deficit of €137 million a year earlier. Exports to the EU edged up 0.4 percent while imports climbed 5.7 percent.
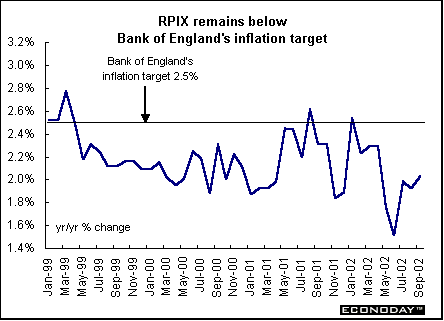
Britain - September retail price index jumped 0.7 percent and rose 1.7 percent on the year. The retail price index excluding mortgage interest payments rose 0.6 percent and 2.1 percent when compared with last year. The RPIX remains below the Bank of England's 2.5 percent rate of inflation. Service sector prices were up 4.8 percent. Goods prices declined 0.9 percent. Services inflation was driven higher by a sharp rise in both shop and non-shop services. RPIX has never moved more than 1 percentage point above or below the 2.5 percent target set in 1997 when the Bank of England's Monetary Policy Committee was set up.
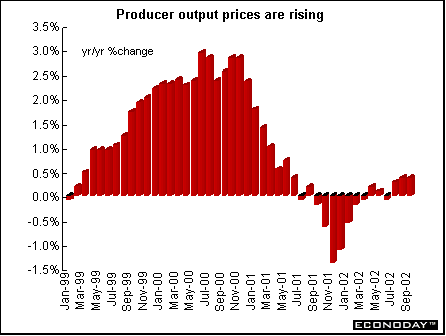
September producer output prices rose 0.1 percent and 0.4 percent when compared with last year. Core output prices, which exclude food, beverages, tobacco and petroleum products, remained unchanged on the month and were up 0.5 percent on the year. Producer input prices also rose 0.1 percent but were down 0.9 percent on the year. Crude oil prices rose 4.5 percent and were up 4 percent on the year. Oil prices have been driven higher recently, in part due to the threat of military action against Iraq. The upward pressure from higher oil prices, though, was offset partially from lower imported goods prices and also cheaper home-produced food materials.
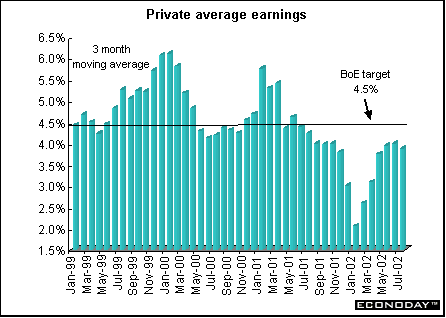
August average earnings rose 3.8 percent, down from 3.9 percent in July. Behind the latest decline was a significant drop in public-sector pay growth. Private-sector earnings growth slipped slightly, to 3.9 percent from 4.0 percent. Excluding bonuses, overall earnings growth fell to 3.4 percent from 3.8 percent previously.
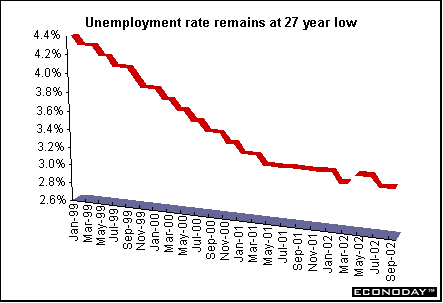
September claimant count measure of unemployment fell 200 on the month. The unemployment rate remained at 3.1 percent for the third consecutive month. On the international standard, the International Labour Organization measure, unemployment fell 5,000 in the latest three months to August. Employment over the same period rose 19,000 to 28.53 million. The ILO unemployment rate remained at 5.2 percent.
Asia
Japan - August revised industrial output increased 1.4 percent from the month earlier, compared with the 1.6 percent increase reported originally. The downward revision in production data was offset somewhat by a brighter picture for shipments, which rose 4.0 percent compared with a preliminary estimate of a 3.3 percent increase. The report also showed that the operating ratio for August, after adjustment for seasonal factors, rose 2.1 percent from July. Factory use, a measure of how much capacity is being used, rose 2.1 percent from July. From a year ago, factory use rose 3.4 percent.
Americas
Canada - August manufacturers' shipments rose 0.6 percent, thanks to higher prices for petroleum and coal products. Wood products increased as well. Shipments in July were up 1.0 percent. August's rise in shipments for August was concentrated in non-durable goods industries, which rose 1.5 percent. Twelve of 21 manufacturing industries representing 55 percent of total shipments increased output. A 3.0 percent drop in the output of motor vehicles offset some of the gain in the month. Excluding the motor vehicle and parts industries, shipments increased 1.1 percent. Unfilled orders rose 0.8 percent after declining 1.4 percent in July. New orders rose 3.0 percent in August, driven by a boost in transportation equipment.
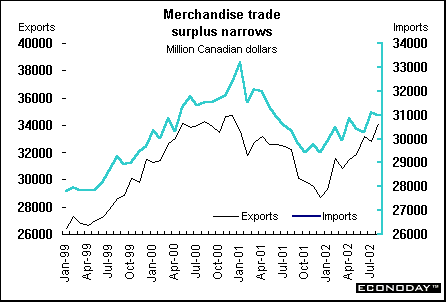
August merchandise trade surplus slid to C$4.1 billion from C$5.0 billion in July. Exports fell 0.6 percent, but imports rose 2.6 percent because of strong activity in the energy and automotive sectors. Canadian companies sent C$29.8 billion in goods to the United States, accounting for nearly 86 percent of total exports. Imports from south of the border increased 2.8 percent to C$22.1 billion. The trade surplus with the United States fell to C$7.7 billion. Canada's trade deficit with countries other than the United States widened from C$3.1 billion in July to C$3.6 billion in August, the result of stronger import activity from all of Canada's principal trading partners. Larger-than-seasonal import volumes of energy products drove a 14.2 percent increase to C$1.5 billion. The risk of conflict in the Middle East pushed prices of crude petroleum and petroleum and coal products up more than 4 percent in August.
 |


Last Week's Highlights • Global
Stock Market Indexes • Recap of Global Markets
• Currencies • Indicator
Scoreboard

The Bottom Line •
Looking Ahead
| ![[Back To Archive]](../../../images/backtoarchive.gif)