
Indicator scoreboard
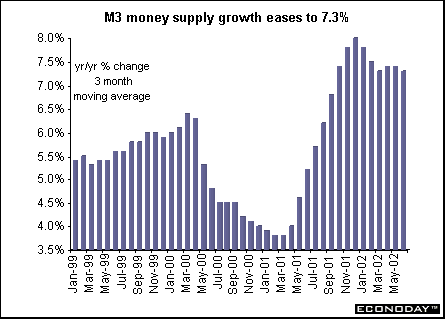
EMU - July seasonally adjusted M3 money supply growth remained at 7.1 percent. The 3-month moving average of annual M3 growth rates - the key indicator for the ECB - eased slightly to 7.3 percent for the May-to-July period, down from an unrevised 7.4 percent for the April-June period. Money supply growth remains well above the ECB's 4.5 percent reference value.
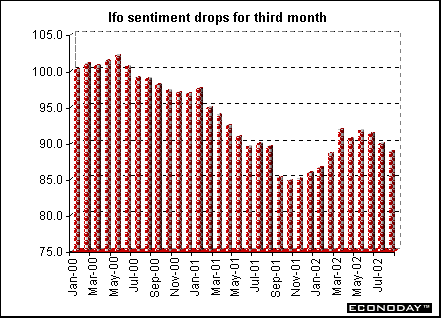
Germany - August Ifo Institute's seasonally adjusted west German business sentiment index fell to 88.8 from 89.9. This was the third consecutive month that the index has fallen. Both business expectations and current conditions dropped, mainly due to a deterioration of manufacturing sentiment. Current business conditions fell to 77.3 from 77.9 in July, while business expectations fell to 100.8 from 102.4.
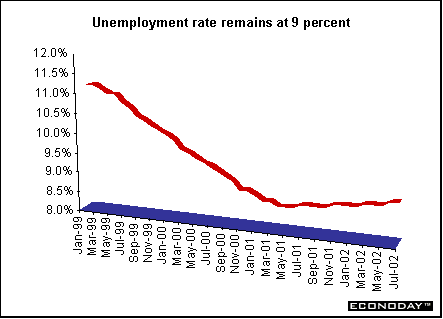
France - July seasonally adjusted unemployment rose by 18,000 when measured by the International Labor Organization definition, which excludes jobseekers that did any work during the month. The ILO unemployment rate remained unchanged at 9.0 percent.
Italy - July producer prices rose 0.3 percent and 0.1 percent when compared with last year. The increase was largely due to higher electricity prices. Excluding energy the PPI was up 0.1 percent and 0.8 percent on the year.
June seasonally adjusted retail sales rose 0.2 percent and 1.4 percent on the year. The retail sales data are not closely watched by analysts because they show no correlation with consumer spending as published in quarterly GDP statistics.
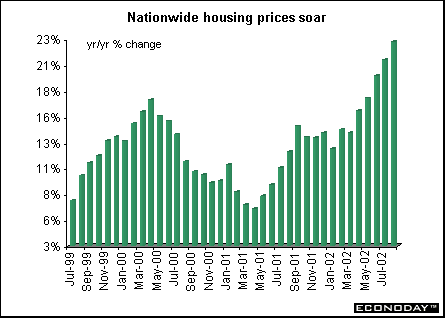
Britain - August Nationwide house price index jumped 2.5 percent and 22.7 percent when compared with last year. The 22.7 percent year-on-year rise in house prices was the highest since second-quarter 1989. Average house prices rose 8.4 percent in the June-to-August period alone. The average price of a house in August was Stg110,890.
Asia
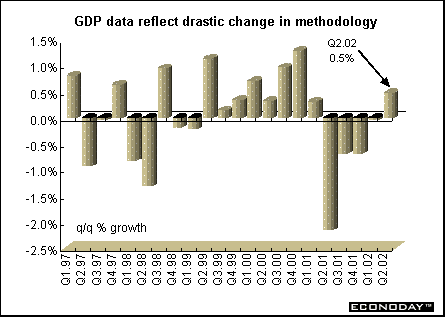
Japan - Second-quarter seasonally adjusted gross domestic product rose 0.5 percent. The first quarter was revised downward to no change from an initial estimate of 1.4 percent. A 10 percent cut in public works spending in the fiscal year that began April 1 was a drag on growth. Government spending sank 0.7 percent. Imports rose 3.8 percent as manufacturers making goods for sale abroad bought more computer chips, steel and other materials from overseas. Consumer spending, which makes up more than half the economy, rose 0.3 percent, after rising 0.5 percent in the first quarter. Capital spending, which accounts for about 15 percent of the economy, fell 0.5 percent in the second quarter after dropping 2 percent in the first. This was the first report for GDP using new, more accurate methods of calculation. It also should permit the release of the data in a more timely basis.
July seasonally adjusted industrial production fell 0.4 percent but rose 3.3 percent from a year earlier, the first gain in 1 1/2 years. July factory shipments fell 0.6 percent while inventories rose 0.6 percent. The inventory ratio, which increases when stockpiles rise faster than shipments, fell by 3.7 percent.
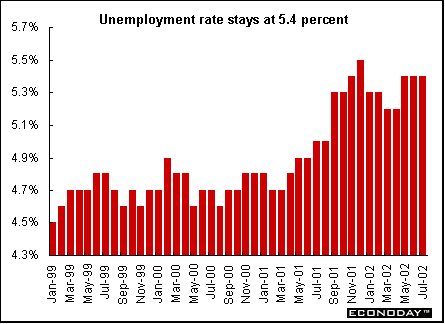
July unemployment remained at 5.4 percent, just shy of a record 5.5 percent. Employment rose by 160,000 jobs, while 120,000 people entered the workforce. The number of unemployed fell by 10,000 to 3.6 million. Manufacturers and farms eliminated jobs while transportation, telecommunication and construction companies added jobs. There were 54 jobs available for every 100 applicants at job placement centers last month, up from 53 in July.
July seasonally adjusted spending by households headed by a salaried worker fell 0.1 percent but rose 1.3 percent when compared with last year. The propensity-to-spend ratio, which rises when people save less and spend more, rose last month to 76.9 percent from June's 73.7 percent.
August seasonally adjusted Tokyo consumer prices, excluding fresh food, rose 0.2 but fell 0.9 percent when compared with last year. July nationwide consumer prices were unchanged and were down 0.8 percent on the year. Not since April 1998 has the index risen from year-earlier levels.
Americas
Canada - July industrial product price index (IPPI) rose 0.2 percent but fell 0.3 percent when compared with last year. Higher prices for petroleum products, meat, fish and dairy products, fruit, vegetable and feed products, and lumber products were the major contributors to the rise. Lower prices for motor vehicles and electrical and communication products partly offset the monthly increases.
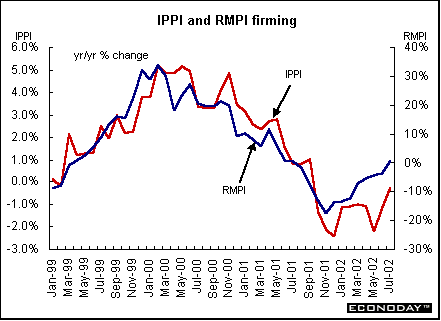
July raw materials price index (RMPI) jumped 2.6 percent and 0.3 percent when compared with last year. Higher prices for mineral fuels, vegetable products and animal products were the major contributors. Price decreases for wood products and ferrous materials slightly offset the increases. Higher prices for vegetable products, non-ferrous metals, wood products and ferrous materials were responsible for the annual rise in the RMPI.
In July, the value of the U.S. dollar weakened against the Canadian dollar, pushing down prices of commodities that are quoted in U.S. dollars. As a result, the total IPPI excluding the effect of the exchange rate would have increased 0.4 percent instead of 0.2 percent. However, on a 12-month basis, the influence of the dollar had less of an impact. The IPPI was down 0.3 percent from July 2001 to July 2002, but without the exchange rate effect the IPPI would have decreased 0.2 percent.
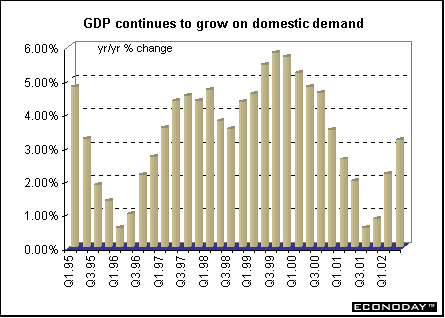
Second quarter gross domestic product climbed 1.1 percent and 3.2 percent when compared with last year. Growth was driven by domestic demand and a build-up of inventories. Final domestic demand rose by 0.9 percent, matching its first-quarter pace. Domestic demand was boosted by strong consumer spending on services and a pick-up of business investment in machinery and equipment, which more than offset an easing of housing investment. Manufacturers, wholesalers and retailers began to replenish stockpiles of inventory after three quarters of drawdowns. Corporate profits continued to recover from their tumble in 2001 and healthy gains in employment pushed up labor income. Imports were up strongly to satisfy domestic demand and the rebuilding of inventory. Business plant and equipment spending recorded its strongest gain since the fourth quarter of 1999, boosted by a 4.8 percent increase in spending on machinery and equipment. Investment in transportation equipment (excluding automobiles and trucks), industrial machinery, and computers and other office equipment were notably up. Building construction remained a source of weakness, but engineering construction edged up after three quarterly declines.
 |


Last Week's Highlights • Global
Stock Market Indexes • Recap of Global Markets
• Currencies • Indicator
Scoreboard

The Bottom Line •
Looking Ahead
| ![[Back To Archive]](../../../images/backtoarchive.gif)