
Indicator scoreboard
EMU - January current account deficit was E1.5 billion, a sharp improvement from the deficit of E11.1 billion in January 2001. The improvement stemmed from a turnaround in the goods balance to a surplus of E2.1 billion from a deficit of E3.9 billion of a year earlier. In contrast, the services account deficit widened to E2.7 billion from E2.4 billion a year ago.
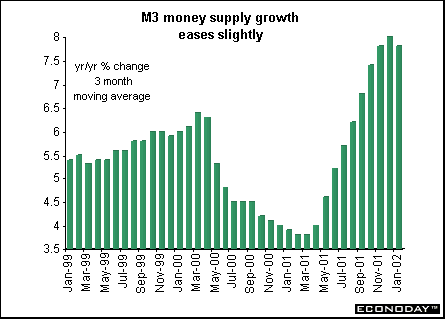
February seasonally adjusted M3 money supply rose by 7.4 percent when compared with last year. For the November-through-February period, the 3-month moving average growth rate eased to 7.8 percent from an unrevised 8.0 percent for the October-through-January period. The 3-month moving average remains substantially above the ECB's 4.5 percent growth reference rate. As before, the ECB attributed the strong rise in M3 to the impact of financial market uncertainty following the September 11 terrorist attacks on the United States, which led to huge shifts into short-term assets by investors looking to boost the liquidity of their portfolios.
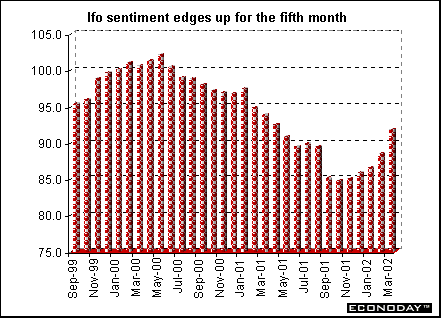
Germany - March Ifo Institute's west German business sentiment index rose to 91.8 from 88.5 in February. The increase was due almost exclusively to a jump in expectations to 106.3 from 101.0 in February. The March level was the highest in almost two years (June 2000). West German current business conditions index inched up to 76.9 from 76.8 in February. East German business sentiment also improved to 100.8 from 100.1.
February producer prices rose 0.1 percent but fell 0.3 percent when compared with last year. PPI energy prices jumped 0.5 percent but fell 2.6 percent on the year. Excluding energy prices, PPI was down 0.1 percent on the month with the annual rate rising 0.3 percent. Producer prices for semi-finished goods excluding energy - which account for some 31 percent of the producer price index - fell 0.2 percent on the month and 1.8 percent on the year. Capital goods prices at the producer level rose 0.3 percent and 1.5 percent on the year. Seasonally adjusted producer prices rose 0.1 percent but fell 0.3 percent on the year.
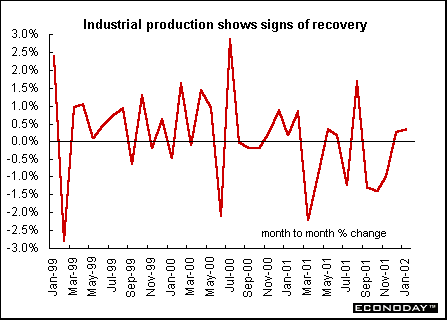
January seasonally adjusted industrial production rose 0.4 percent but fell 4.4 percent when compared with last year. The data continue to support to the notion of a gradual recovery for German industry early this year. Excluding construction, industrial production jumped 1.0 percent but was still down 4.4 percent on the year. Manufacturing output rose 1.5 percent but construction output plunged 6.6 percent and energy output sank 3.9 percent.
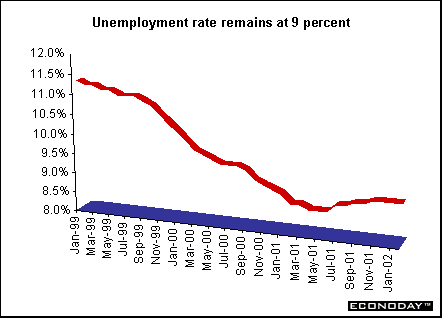
France - February unemployment rate remained at 9 percent for the fourth month. However, the number of unemployed declined for the first time since June, dropping by 4,000 according to the International Labour Organization definition, which excludes jobseekers who did any work during the month.
February producer prices were unchanged as higher energy costs were offset by declines for food and most other categories. When compared with last year, the PPI fell 1.3 percent. Excluding energy and agriculture, the core PPI was unchanged but was down by 0.3 percent on the year. Energy prices rose 0.6 percent but were still 7.8 percent lower on the year.
Italy - January seasonally adjusted unemployment rate slipped to 9.1 percent from 9.2 percent in September. This was its lowest level since the index was created in 1993. Employment surveys are carried out every three months (but the previous one was brought forward to September rather than October). The total number of unemployed in January stood at 2.172 million, down a seasonally adjusted 1.4 percent from September.
January industrial orders rose 2.9 percent when compared with last year following an 8.6 percent drop in December. Domestic orders rose 2.2 percent and foreign orders jumped 3.7 percent. Domestic orders account for around 62 percent of the overall index, with foreign orders making up some 37 percent. Three of ten product sectors rose. The steepest rise was in the electric and precision appliances production, up 16.8 percent; the biggest drop was posted by the synthetic fibers sector, down 22.5 percent.
February merchandise trade surplus was E314 million, compared with a surplus of E168 million in February 2001. Non-EU exports were 1.6 percent lower while imports plummeted 3.7 percent. The annual level of imports has fallen for seven consecutive months. January trade balance with EU partners worsened to a deficit of E314 million, compared with a deficit of E107 million a year ago. Exports fell 8.3 percent while imports declined 6.2 percent.
January seasonally adjusted retail sales rose 0.4 percent and jumped 2.6 percent when compared with last year. ISTAT, the Italian statistical agency, announced that "maybe" starting with February's release it will re-base the index, with a 2000 base year to replace the previous 1995 base year. A considerably higher weighting will be given to large retail outlets, which will make up some 23 percent of the index instead of the current 16 percent. Analysts don't pay as much attention to retail sales under the current index as they show no correlation with consumer spending as published in quarterly GDP statistics.
February producer prices fell 0.1 percent and 1.4 percent when compared with last year. The decline was due to lower natural gas prices. Excluding energy the PPI is unchanged but up 0.3 percent on the year. Intermediate goods fell 0.2 percent and were down 3.6 percent on the year. Consumer goods edged up 0.1 percent and 1.7 percent on the year.
Britain - Fourth quarter gross domestic product was unchanged on the quarter but was revised down to 1.6 percent when compared with last year. Although the latest quarterly estimate was unrevised, there were significant changes in the various GDP components. Households' expenditure was revised down to show a rise of 0.9 percent on the quarter from a previously estimated 1.2 percent gain. But investment was revised sharply higher to show a 0.7 percent quarterly rise against a previously estimated 1.7 percent fall. Government spending was also revised up to a show a 1.4 percent quarterly increase from 0.2 percent previously.
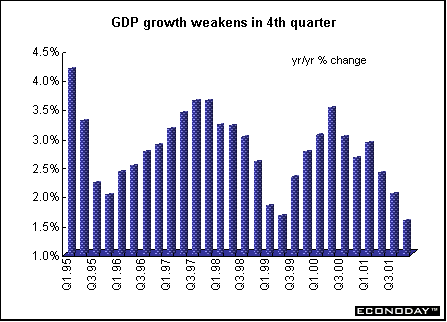
Fourth quarter productivity declined 0.1 percent when compared with the previous quarter but was 0.8 percent above levels of a year earlier. This was the first quarterly decline since the first quarter of 1999. Manufacturing productivity fell 0.4 percent and was 1.0 percent below levels of a year earlier.
Asia
Japan - February seasonally adjusted retail sales fell 0.8 percent and 6.1 percent when compared with last year for the biggest decline in 26 months. Sales at supermarkets and department stores open at least a year declined 4.7 percent. Clothing sales fell 15 percent from a year ago, while food sales dropped 2.9 percent and household goods declined 15 percent. Spending on clothing, which accounts for about a third of sales at department stores and a sixth of sales at supermarkets, declined 5.1 percent last month when temperatures in Tokyo were higher than average.
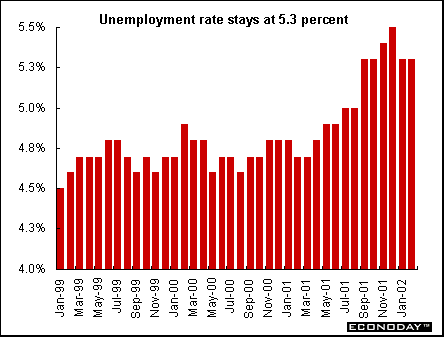
February unemployment rate remained at 5.3 percent. The total number of jobless rose for the 11th straight month increasing by 380,000 from the year earlier to 3.6 million. The economy regained 90,000 of the 230,000 jobs lost in January. There were 50 jobs available for every 100 applicants at government-run work centers last month, down from 51 people per 100 jobs in January. A year ago there were almost two jobs for every three applicants. Job cuts may have accelerated this month as companies try to complete severance plans before Sunday, when the fiscal year ends, and put billions of yen in charges behind them. The number of part-time workers rose 1.1 percent from a year ago to 5.76 million. The number of full-time jobs dropped 1.5 percent to 52.4 million, the sixth straight decline.
February spending by households headed by a salaried worker fell 1.9 percent and 2.9 percent when compared with a year ago. Consumer spending accounts for about 55 percent of GDP. The seasonally adjusted propensity for wage earners to consume, which is a ratio that measures the amount of disposable income that went to household spending, rose to 69.9 percent from 69.6 percent.
February seasonally adjusted factory production rose 1.3 percent after falling 1.5 percent to a 14-year low in January. When compared with last year, production was 11.3 percent lower. Shipments rose 1.4 percent. Inventories fell for sixth month, down 0.6 percent. The inventory ratio, which falls when shipments rise faster than inventories, dropped 0.1 percent.
March Tokyo seasonally adjusted consumer prices, excluding fresh food, rose 0.1 percent but fell 1.2 percent when compared with last year. February nationwide consumer price index fell 1.6 percent from a year earlier.
Americas
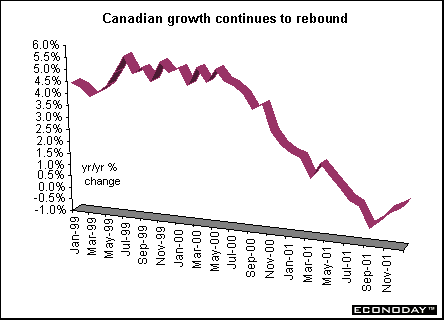
Canada - January gross domestic product advanced 0.6 percent for the fourth consecutive monthly gain as consumers continued to provide the impetus for the economic turnaround. This was the strongest monthly increase since early in 2000. Consumers' recent insatiable demand for housing and cars led to higher output in many industrial sectors. Travel-related industries were busier due to improved confidence on the part of both Canadian and foreign tourists. The manufacturing sector, which had been in decline since September 2000, jumped 1.5 percent, the first significant advance in more than 16 months. The largest manufacturing gains were concentrated in the production of wood, chemical, plastic, rubber and paper products. Increased drilling and rigging activity and expanded oil production helped the mining sector increase output for the first time since September.
February industrial product price index (IPPI) rose 0.3 percent but fell 1.4 percent when compared with last year, the fifth consecutive month of decline. On an annual basis, petroleum and coal product prices fell a substantial 24.7 percent, the eighth straight month of decline. If petroleum and coal product prices had been excluded, the IPPI would have increased 0.3 percent instead of falling 1.4 percent on the year. Price decreases for pulp and paper products, primary metal products and chemical products also contributed to the annual decline in manufacturers' prices. This decline was partly offset by higher prices for motor vehicles and lumber products.
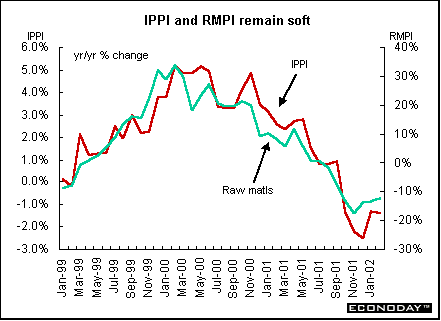
February raw materials price index (RMPI) soared 2.2 percent but declined 12.3 percent when compared with last year. The latter was the seventh consecutive month of retreat. Mineral fuels, down 23.2 percent, were responsible for most of the decline along with wood products and non-ferrous metals on the year. If mineral fuels had been excluded, the RMPI would have declined 3.0 percent on the year. On a monthly basis, higher prices for mineral fuels, animal products and wood products were the major contributors to the monthly increase. In the RMPI, February crude oil prices were 5.6 percent higher due in part to production cuts by the Organization of Petroleum Exporting Countries and decreasing inventories. This increase was to some degree reflected in the IPPI, as petroleum and coal product prices were up 0.3 percent from January.
The value of the Canadian dollar against the U.S. dollar was virtually unchanged and had no real impact on the prices of commodities that are quoted in U.S. dollars. As a result, the change in the IPPI including and excluding the effect of the exchange rate is the same. However, the influence of the dollar was strong when compared with last year. The IPPI was down 1.4 percent on the year, but without the exchange rate effect the IPPI would have decreased 2.5 percent.


Last Week's Highlights • Global
Stock Market Indexes • Recap of Global Markets
• Currencies • Indicator
Scoreboard

The Bottom Line •
Looking Ahead
|