
Indicator scoreboard
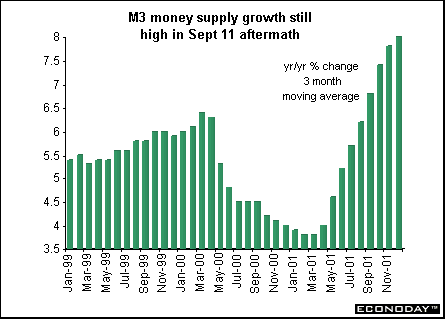
EMU - January seasonally adjusted M3 money supply growth rate was 7.9 percent when compared with last year. The three-month moving average growth rate rose 8.0 percent when compared to the three months a year earlier. The ECB's target growth rate for the three-month moving average is 4.5 percent. The ECB again played down the potential risk to inflation in the euro area. As before, it attributed the strong rise in M3 to the impact of financial market uncertainty following the September 11 terrorist attacks, which led to huge shifts into short term assets by investors looking to boost the liquidity of their portfolios.
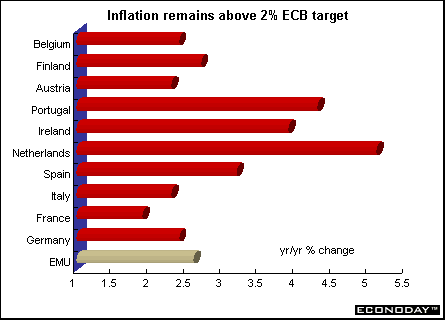
January harmonized index of consumer prices (HICP) rose 0.5 percent and 2.7 percent when compared with last year. Most of the gain was due to one-time factors such as tax increases and weather-elated price increases for seasonal foods. Core HICP rate - excluding energy, food, alcohol and tobacco - slipped 0.1 percent but rose 2.4 percent on the year. All 12 eurozone countries had inflation rates at or above the ECB's 2 percent price stability limit.
December real, workday and seasonally adjusted retail sales fell 0.6 percent and rose only 0.4 percent on the year. All retail trade categories declined. Non-specialized stores fell 8.6 percent; mail orders fell 1.5 percent; textiles, clothing and footwear fell 0.8 percent; household goods fell 0.6 percent, and books, newspaper and other sales in specialized stores fell 0.4 percent.
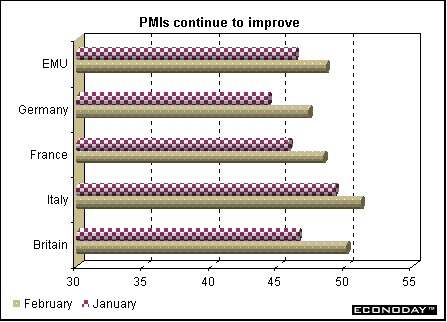
February Reuters seasonally adjusted purchasing managers' index for the manufacturing sector rose to 48.6 from 46.3 in January. New orders and output expanded for the first time since spring 2001, suggesting the manufacturing recession is coming to an end after 11 months of contraction. An index level below 50 means that the PMI contracted, and the further the index is below 50, the faster the contraction. Italy managed to crawl barely above the 50 level while activity continued to weaken in France and Germany, but at a slower pace.
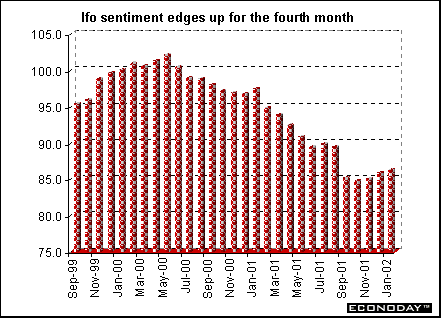
Germany - February Ifo Institute's west German business sentiment index jumped to 88.7 from 86.2 in January. The sharp rise in expectations more than offset a further drop in current conditions. The February increase was the fourth in a row and the level was the highest since August 2001. Business expectations jumped from 94.8 in January to 101.0 in February, the highest level since December 2000. The month-over-month jump of 6.2 points was the largest in more than 17 years according to Ifo historical data back to 1985. Current conditions, on the other hand, fell to 76.8 in February from 78.0 in January.
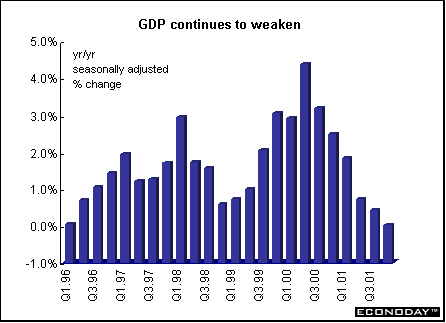
Fourth quarter seasonally adjusted gross domestic product fell 0.3 percent, confirming that the economy is in technical recession. GDP fell 0.2 percent in the third quarter. All major categories declined quarter-over-quarter, except for inventory change and government spending. Consumer spending fell for the second quarter in a row, while investment activity declined for the fifth quarter in a row. Exports plunged while imports were flat.
January seasonally adjusted producer prices rose 0.7 percent and 0.1 percent when compared with last year. Tax increases that took effect at the start of the year pushed prices higher. Excluding oil product prices, PPI was up 0.5 percent and 0.3 percent on the year.
France - January harmonized index of consumer prices jumped 0.5 percent and 2.4 percent when compared with last year. Higher fresh food, tobacco and services prices offset seasonal discounts on clothing.
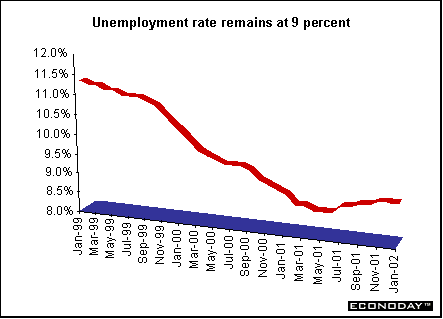
January unemployment rate remained at 9.0 percent even though the number of unemployed rose by 5,000 - the seventh straight monthly gain. Temporary retail and banking hiring linked to the euro cash introduction has dampened the upward unemployment trend since November.
January producer prices edged up 0.1 percent as lower food and agriculture prices were offset by a rebound in energy costs. When compared with last year, the PPI fell 1.2 percent. Energy prices jumped 1.6 percent in January after three months of decline but were still 8.0 percent lower on the year. Excluding energy and agriculture, the core PPI was flat on the month and dipped 0.1 percent on the year.
Italy - Preliminary seasonally but not workday adjusted fourth quarter gross domestic product fell 0.2 percent and was up 0.7 percent when compared with last year. The fourth quarter had one less working day than the third quarter and two more working days than fourth quarter 2000. No data on the components was supplied.
January producer prices rose 0.1 but fell 1.2 percent when compared with last year. Excluding energy, the PPI would have risen 0.2 percent and 0.4 percent on the year.
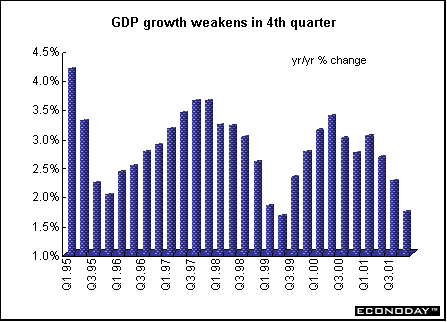
Britain - Fourth quarter gross domestic product was revised down to unchanged and up 1.7 percent when compared with last year. The downward revision was due largely to a cut in the estimate of services output, which was lowered to 0.7 percent on the quarter from 0.9 percent. Despite the lack of growth in the fourth quarter, these figures mask underlying strength in core areas of the economy. Household spending rose 1.2 percent and was up 4.6 percent on the year. However, manufacturing output declined 1.7 percent and 5.6 percent on the year - its largest annual drop since the third quarter of 1991. Overall quarterly GDP growth was depressed by the widening merchandise trade gap. Fixed capital formation fell 1.7 percent and 4.6 percent on levels a year earlier. General government expenditure rose only 0.2 percent and 2.8 percent on the year.
February Nationwide house price index jumped 1.6 percent and 14 percent when compared with last year. Housing has been very strong and shows no evidence of slowing down. A shortage of supply of new dwellings coupled with benign economic conditions and low mortgage rates fueled the latest prices rises.
February Chartered Institute of Purchasing and Supply manufacturing activity index rose to 50.1 from 46.5 in January. This is the first time in 12 months that manufacturing has expanded. The rise was driven by strong growth in output, exports and new orders. The main impetus for growth came from the consumer goods sector, which has consistently managed to avoid the decline seen elsewhere in the industry. There was also a slight output increase in the capital goods sector, and manufacturers of intermediate goods saw order books rise for the first time for 12 months.
Asia
Japan - January industrial production fell 1 percent and 11.1 percent from a year earlier. Inventories fell 1.1 percent - the fifth straight decline - to the lowest level in more than five years. Companies moving factories to cheaper countries such as China are exacerbating the slide in production.
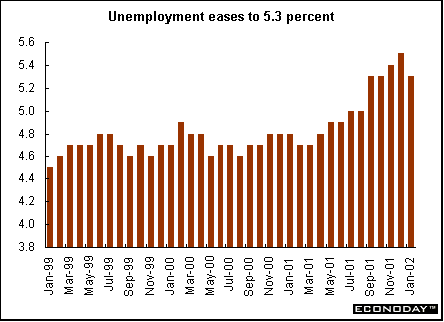
January job losses totaled 230,000 even though the unemployment rate dropped to 5.3 percent. This was the first decline in a year, as people gave up looking for work because jobs have become scarcer. December's jobless rate, while down to 5.5 percent from an initial estimate of 5.6 percent, is still the highest on record. The number of people not looking for work rose by 1.2 million from a year earlier to 43 million. A total 3.55 million people are registered as unemployed. There were 51 jobs for every 100 applicants at state-run work centers in January, down from 65 jobs for every 100 applicants a year ago.
January seasonally adjusted spending by households headed by salaried workers rose 4.6 percent following a 6.9 percent drop in December. The propensity to spend ratio fell to 69.6 percent from 73 in December. When compared with last year, household spending posted the biggest drop in 28 years, sinking 6.6 percent on the year.
January seasonally adjusted merchandise trade surplus rose to 666.5 billion yen ($23.3 billion) from a revised 475.6 billion yen. Exports rose 8.5 percent - the biggest increase since February 2000. Car exports rose 25 percent from a year earlier and steel exports rose 27 percent. By volume, overall exports fell 1.9 percent from a year earlier. Imports are rising as more Japanese companies move factories to China and other lower-cost manufacturing bases, and sell the goods to Japanese consumers. Japan had a 45.5 billion trade deficit with the rest of Asia last month as imports surpassed exports. Measured by value, January seasonally adjusted imports rose 4 percent. By volume, imports fell 6.1 percent from a year earlier, slowing from a 9.2 percent drop in December.
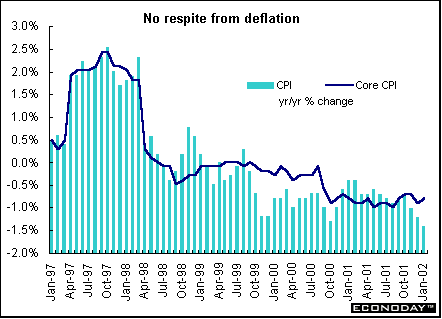
February Tokyo consumer price index fell 0.2 percent and 1.7 percent when compared with last year. The core CPI, which excludes fresh food, rose 0.1 percent but fell 0.9 percent from a year ago. January nationwide seasonally adjusted consumer prices rose 0.2 percent while core prices were unchanged. From a year ago, prices fell 1.4 percent, while core prices fell 0.8 percent.
Americas
Canada - January industrial product price index (IPPI) rose 0.9 percent but was down 1.2 percent when compared with last year. Excluding petroleum and coal, the IPPI increased 0.6 percent. Rising prices for autos, trucks and other transportation equipment and primary metal products were the major contributors to January's increase.
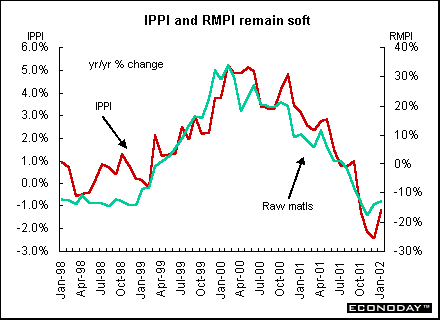
January raw materials price index (RMPI) rose 2.6 percent. Higher prices for mineral fuels, animal products and non-ferrous metals were the major contributors to the monthly increase. When compared with last year, however, the RMPI sank 13.0 percent. Mineral fuels were responsible for most of the drop but wood products and non-ferrous metals also fell. If mineral fuels had been excluded, the RMPI would have declined 2.0 percent. These decreases were partly offset by higher prices for vegetable products, animal products and ferrous materials.
From December to January, the value of the U.S. dollar strengthened against the Canadian dollar, pushing up prices of commodities that are quoted in U.S. dollars, notably automobiles and lumber. If the exchange rate had remained unchanged, the IPPI would have increased 0.4 percent. The IPPI was down 1.2 percent in January 2002 from January 2001, but without the exchange rate effect the IPPI would have decreased 2.7 percent.
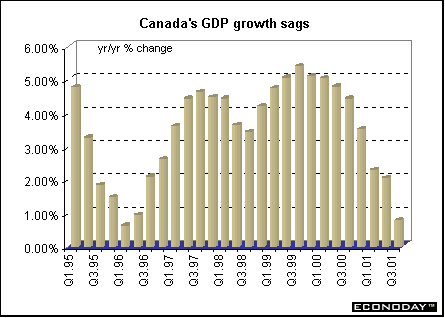
Fourth quarter gross domestic product (GDP) rose 0.5 percent and 1.5 percent when compared with last year. This was the strongest quarterly growth in five quarters, but the weakest annual growth since 1992. Domestic demand was driven by a rebound in consumer spending, which more than offset a decline of fixed capital business investment. Imports dropped off more sharply than exports, and businesses met the resulting shortfall of supply to domestic demand by drawing down inventories and stepping up production.


Last Week's Highlights • Global
Stock Market Indexes • Recap of Global Markets
• Currencies • Indicator
Scoreboard

The Bottom Line •
Looking Ahead
|