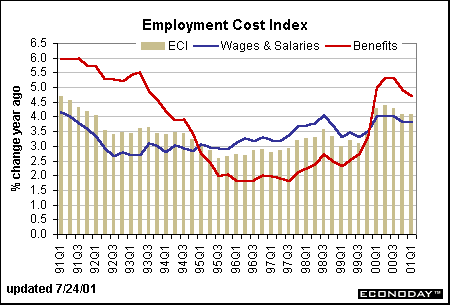
The employment cost index (ECI) is a quarterly index of total compensation costs. Total compensation includes wages and salaries as well as benefits. Wages and salaries run about two-thirds of compensation and benefits are about one-third. This quarterly index was long monitored by economists, but only came to the forefront in the marketplace in 1996 when Fed officials such as then vice-chairman Alan Blinder indicated that the measure was closely followed at the Fed to help determine the direction of inflation. Of course, it continues to be an important indicator among Fed officials. The total ECI peaked in the second quarter of 2000 at 4.4 percent on a year-over-year basis. It has since edged down to 4.1 percent in the first quarter of 2001. The second quarter figures will be out on Thursday. The chart shows that the bulk of the acceleration in the ECI came from higher costs for benefits because wages and salaries picked up only modestly in the past 18 months. In fact, a significant deceleration in benefit costs came about in the mid-1990s as medical care costs and insurance premiums moderated substantially. These began to pick up steam at the end of 1999.

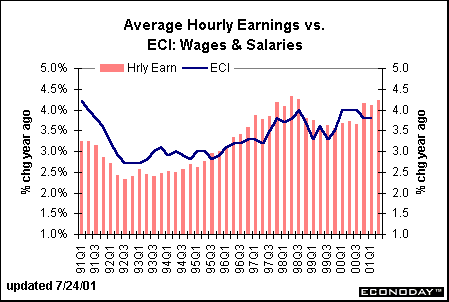
Economists are predicting that the ECI will rise 1 percent in the three months ending in June - and that translates into a 4 percent year-over-year gain in the total compensation index. Data isn't available for the benefits portion, but the average hourly earnings data that come from the establishment survey from the monthly employment situation can help predict the direction of wages and salaries. The chart below depicts the strong correlation between hourly earnings and the wages and salaries component of the ECI. Two major definitional differences account for differences in behavior patterns. First, hourly earnings are not adjusted for overtime, but ECI wages and salaries are adjusted for overtime pay. Also, hourly earnings are not adjusted for shifts in the composition of employment. In fact, the ECI does adjust for compositions shifts whether we are moving away from manufacturing and towards services, or even just shifts within different manufacturing industries. In the three months ending June, average hourly earnings rose 4.2 percent, up from a 4.1 percent gain on a year-over-year basis in the first quarter. It does appear that wages and salaries have stabilized over the past three quarters. This should keep the wages and salaries component of the ECI in the same range as well.

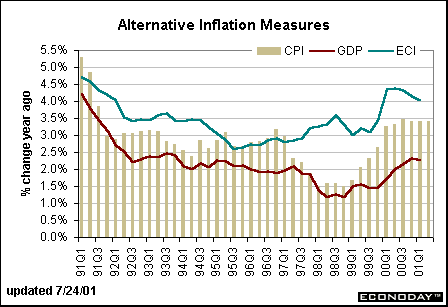
Fed officials and economists closely monitor the employment cost index because it is considered a leading indicator of consumer prices. If compensations costs accelerate without accompanying increases in productivity, then businesses will have to raise product prices in order to maintain profits. The chart below compares year-over-year changes in the employment cost index to two common measures of inflation: the consumer price index and the GDP deflator. Notice that these inflation measures generally move in tandem, although special factors may hold down price increases for goods and services even with higher compensation costs. For instance, energy prices were falling in 1998 and helped hold down the CPI and the GDP deflator. Incidentally, the GDP deflator is running at a lower inflation rate than the CPI for a couple of reasons. One, it incorporates business goods which are lower priced than consumer goods, and also, it allows for substitutes from higher priced goods and services to lower priced goods and services.


Evelina M. Tainer, Chief Economist, Econoday
|
