
Housing starts trend lower
Housing starts fell for the second straight month to a 1.613 million-unit rate. While total housing starts are down 1 percent from a year ago, the March pace is still stronger than the May to December 2000 period. But a couple of factors suggest that the weak trend could continue for several months. The bulk of the February and March strength was concentrated in the multi-family sector, which tends to be more speculative and fluctuates more dramatically than single-family construction. Starts of single-family homes, on the other hand, declined for the second straight month despite another dip in the mortgage rate to 6.95 percent in March. As employment and earnings have moderated in the past few months, consumers may find that income growth isn't sufficiently strong to pursue new housing activities. Certainly, consumers aren't getting additional wealth from the equity market as they were over a year ago.
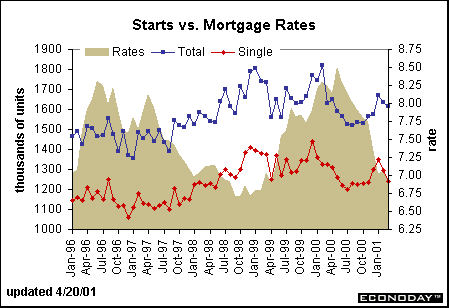
Economists are always looking for leading indicators of activity. Housing permits dropped 3.6 percent in March on top of a 2.8 percent decline in February. In addition, the construction supplies component of industrial production declined 0.3 percent in March, posting its sixth consecutive monthly decline. If the demand for construction supplies is declining, surely, housing starts will likely trend lower for a few months.
While the housing figures do point to slower growth - meaning that retail sales for furniture and appliances will likely decline in the next several months as well - housing activity is by no means in a recessionary state. But slower growth in new housing construction will translate into declines in residential investment in the quarterly GDP measures and dampen overall economic growth.
Industrial production surprises
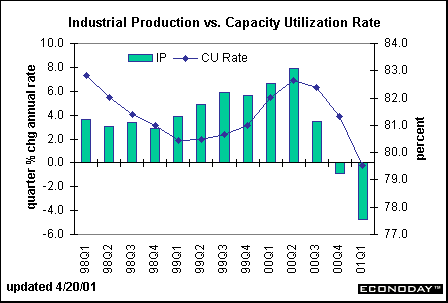
The index of industrial production rose 0.4 percent in March, reversing the previous month's drop. The March gain was a surprise to market players who had been expecting the index to decline for the sixth straight month. Many economists discounted the March hike in production noting that the index was unchanged after removing the impact of higher auto assemblies. Indeed, the industrial production index decreased at a 4.7 percent annual rate in the first quarter of 2001 - its largest quarterly drop since the 1990-91 recession.
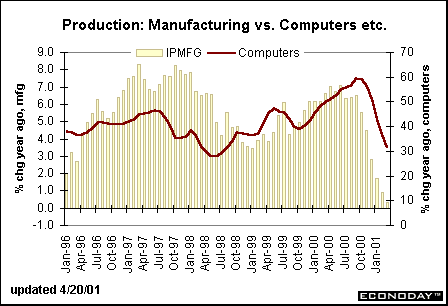
It's true that one month doesn't make a trend. It is very important to monitor production for a couple more months to declare that the recession in the manufacturing sector is over. Analysts are particularly worried that the one sector which can propel growth the most - high tech - is itself on the wane. The chart below compares yearly gains in manufacturing relative to production in computers and office equipment. Both are headed lower on a year-over-year basis. But note that production of computers is still up more than 30 percent from year ago levels! Monthly gains have moderated, but remain positive.
The industrial production figures have been sufficiently weak that they undoubtedly played a role in the Fed's interest rate cut decision on Wednesday. The Fed will have another set of industrial production numbers prior to their May 15 meeting to see if March's up-tick in overall production was a fluke.
CPI comes in with expectations
The consumer price index edged up 0.1 percent in March, posting larger gains in January and February. The improvement in the CPI for the month helped to bring down the year-over-year rise to 3 percent, from 3.5 percent last month. However, many analysts are still worried about accelerating consumer prices since the CPI rose at a 4 percent rate in the first quarter, the largest quarterly rise since the early 1990s.
Energy prices decreased 2.1 percent in March, but even with a slight drop in February, it wasn't enough to offset the 3.9 percent gain posted in January. Moreover, officials at the Bureau of Labor Statistics (where the data are compiled) are estimating that gasoline prices are slated to post a rise in the April CPI. Through March, energy prices were 6.0 percent higher than a year earlier.
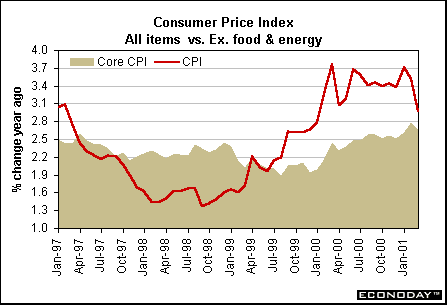
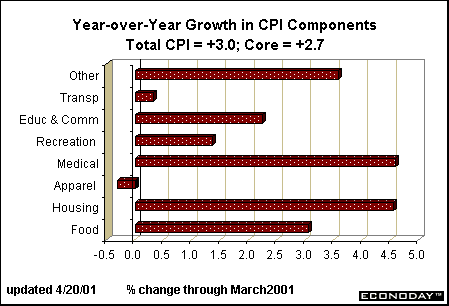
Excluding the volatile food and energy component, the CPI rose 0.2 percent in March, a bit less than the 0.3 percent gains posted in each of the previous two months. This put the core CPI 2.7 percent above a year ago, pretty much in line with the past couple of months. The two sectors with the largest yearly gains are medical care and housing. The acceleration in housing is due to the spurt in utility prices in the past year. Medical care has long been a sector where prices rise faster than other goods and services. In 1998 and 1999, medical care costs had moderated significantly, posting yearly gains of 2 to 2.5 percent. But a resurgence in these costs began in early 2000 and prices have accelerated sharply since then. The "other" category includes tobacco products where prices fluctuate sharply from month to month, but generally press higher.
The quarterly acceleration in the CPI won't go unnoticed by Fed officials who must monitor inflationary pressures above all else. However, the producer price index suggests that inflationary pressures are not in the pipeline. And evidently the Fed wasn't hampered at all by potential inflation problems when they eased aggressively on Wednesday!
International trade deficit surprises
Again, the good news in the international trade data was that the deficit sank much more than expected to $27 billion, down from January's $33.3 billion and its narrowest reading in more than a year. However, the cause of the decline - reduced imports because of anemic demand - is not a good omen. It means that domestic demand is really soft. Reduced imports of oil and consumer goods contributed to the decline to $27 billion, the smallest since the $25.7 billion deficit in December 1999. The size of the decline in the February deficit was the largest since the government started tracking the monthly trade balance in both goods and services in 1992. February's 4.4 percent drop in imports, also the largest on record, suggests businesses are expecting the slowdown in consumer spending to persist.
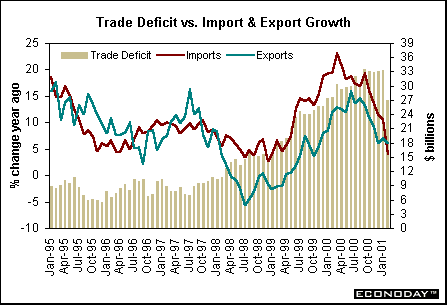
Exports rose for a second consecutive month in February. The one percent gain, after a 0.4 percent increase a month earlier, was led by aircraft, chemicals, telecommunications equipment and farm products. When the economy slows down, you tend to import less and this could continue into the second quarter. The rest of world isn't slowing quite as fast as the United States yet, so exports might be more of a problem later this year or next year.
The drop in imports of consumer goods sent the trade shortfall with China down to $5.1 billion, the lowest since April 1999. The government also reported that the trade deficits with Asia's emerging economies (Hong Kong, Korea, Singapore and Taiwan) were the lowest since December 1998. The trade deficit in goods with Japan widened to $6.1 billion in February from $5.9 billion in January. A year ago, the deficit was $6.7 billion. The deficit with Canada, the largest U.S. trading partner, narrowed to $4.5 billion from $5.9 billion. The details of the trade report will add to U.S. first quarter GDP growth and might prove friendly to the dollar. But the bottom line is that a slowing U.S. economy appeared to cut demand with only a short time lag. The cut backs were particularly pronounced for smaller goods imported from the developing countries as well as for oil.


Markets at a Glance • Recap of US Markets • The Economy • The Bottom Line • Looking Ahead
|