
Manufacturing still in the dumps
The business barometer from the Chicago purchasing managers' index dropped sharply in March to 35.0 from a level of 43.2 in February. The level was the lowest since March 1982 when the U.S. was in a deep and long recession. This index is considered a leading indicator of the NAPM Survey because the distribution of manufacturing industries in Chicago mirrors the nation's. As indicated in the chart below, the NAPM tends to move less dramatically than the PMAC survey. But you can see that the direction of these two series moves in tandem. This suggests that the NAPM survey, reported on Monday, April 3, could well drop from February's 41.9 percent level.
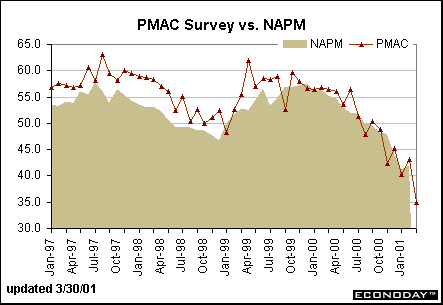
The Chicago purchasing managers' index strongly indicates that the manufacturing sector remained mired in the mud in March. Indeed, manufacturing activity appears to be weakening at an accelerating pace. There were also abundant signs of manufacturing weakness outside the Chicago report. New orders for manufacturers' durable goods dipped 0.2 percent in February after plunging 7.3 percent in January. The volatile aircraft industry played a role in the downdraft, but others were generally anemic. New orders for nondefense capital goods excluding aircraft declined 4 percent in February, totally reversing the previous month's gain.
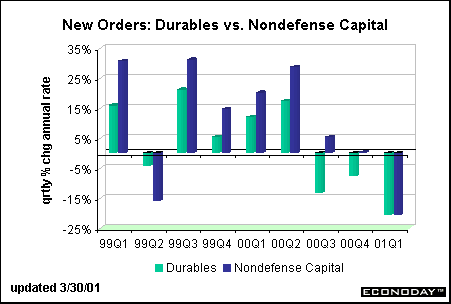
The chart above depicts quarterly changes at annual rates in total durable goods and nondefense capital goods orders. The first quarter figures incorporate data for January and February (March has not yet been released). The chart is quite telling. The weakness in orders began in the second half of 2000 and the drop in nondefense capital goods orders (a leading indicator of capital spending) only began to turn down at the end of 2000. The sharp falloff in the first quarter of 2001 signals more declines in industrial production over the next few months.
Consumer confidence turns up - permanently or temporarily?
The Conference Board's consumer confidence index gained eight points to reach 117.0 in March. This boosted the stock market on Tuesday and sparked a sharp fall in prices of Treasury securities, as bond investors feared that the rise in consumer confidence would diminish the Fed's reasons for further aggressive easing moves. On Friday, the University of Michigan's consumer sentiment index edged up in March as well, but recorded a smaller 0.9 percentage point move in the index to 91.5. In the context of a longer time frame - for instance over the four years depicted in the chart below - one can see that the March gains are hardly consequential in the whole scheme of things.
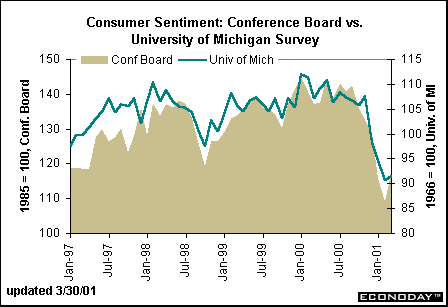
It is certainly possible that consumer confidence will continue to rise in the next couple of months, but we've actually started to see some deterioration in the job situation, which is a key component of the Conference Board's survey. It remains to be seen in which direction consumer confidence will head over the next few months - particularly if stock prices aren't headed decidedly higher.
Will consumer confidence lead to stronger consumer spending?
The Commerce Department reported that personal income rose 0.4 percent in February, just a tick less than the 0.5 percent gains posted in the two previous months. Wages and salaries, the lion's share of personal income, posted solid gains in the first two months of the year after moderating significantly in November and December.
At the same time, personal consumption expenditures edged up 0.3 percent in February after gaining a healthy 1 percent in January. Durable goods spending was strong in February, but spending on nondurable goods dropped - reversing the previous month's gain. Spending on services was sluggish as well.
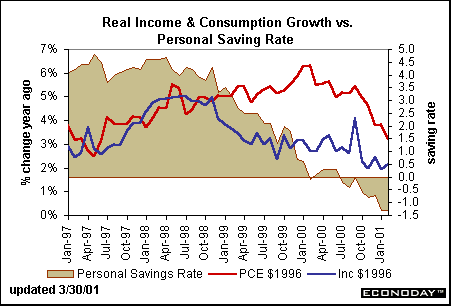
The chart above indicates that the pace of consumer spending has moderately significantly in the past year. For the most part, annual income growth has been more stable than consumption growth, but both have headed on a downward path. The gap between the two series is also narrowing, but not enough to stem the flow of red ink in the form of "negative savings". The personal savings rate hit -1.3 percent in January and remained there in February. Economists have generally pointed out that this savings measure is not adequate because it allows for capital gains taxes (in income) but doesn't allow for capital appreciation. Nevertheless, the series in the chart is consistent over time. It is relevant that the savings rate was nearly 5 percent (by this measure) in 1997, but has since become negative. Typically, consumers will start adding to their savings when they feel uncertain about economic conditions and are worried about their job outlook. The drop in consumer confidence has certainly been sharp, yet consumers haven't felt worried enough to start adding to their savings. One thing is certain, if economic conditions worsen dramatically and job losses are severe, high debt burdens with no savings could cause a spending debacle.
Consumers as investors - still going strong
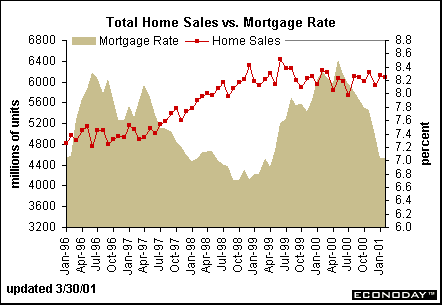
Sales of existing single-family homes dipped 0.4 percent in February to a 5.18 million-unit rate while sales of new single-family homes decreased 2.4 percent during the month to a 911,000-unit rate. From the chart below, one can see that the overall pace of housing activity has remained rather stable these past twelve months after peaking in mid-1999. The plunge in stock prices probably curtailed a faster pace of housing investment, but income growth has been relatively stable over the time period and a sharp drop in mortgage rates helped to improve affordability. Mortgage rates have declined 150 basis points over the past year.
Home sales are typically associated with spending on furniture, home furnishings and appliances. Since the growth in home sales is not accelerating at a rapid rate, it means that spending on these household items won't accelerate either. In fact, the portion of retail sales related to furniture and home appliances has shown some moderation in its annual rate of growth. Nevertheless, activity is still higher than it was a year ago.
If the Federal Reserve reduces interest rates, as market players and most economists expect, we could see a further decline in mortgage rates. However, the drop in mortgage rates will not be as dramatic as the one we've seen in the past twelve months, so the upside potential in housing coming from lower interest rates is limited.
Q4 profits are down, says Commerce Department
The Commerce Department's second revision showed that real GDP grew at a 1 percent rate in the fourth quarter of 2000, half the pace recorded in the third quarter and the smallest growth since the second quarter of 1995. The GDP revision revealed nothing new about the economy. This was the first release of fourth quarter corporate profits however. Not surprisingly, after-tax profits dropped 4.3 percent in the fourth quarter relative to the third quarter. Corporate profits are generally viewed on a year-over-year basis, however, and these didn't look quite as dire, although they were still weak. After-tax profits rose 4.4 percent from the fourth quarter of 1999. Notice in the chart below how the pattern of profit growth has dissipated over the course of the year.
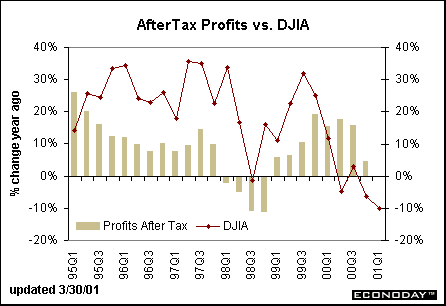
The Dow Jones Industrial Average posted another quarter-to-quarter decline. It is signaling further weakness in first quarter profits. Indeed, most analysts are predicting a drop in profits for the quarter.


Markets at a Glance • Recap of US Markets • The Economy • The Bottom Line • Looking Ahead
|