
Indicator scoreboard
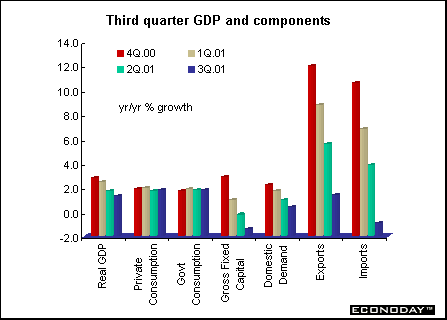
EMU - Third quarter gross domestic product rose 0.1 percent and was up 1.3 percent when compared with last year. A rise in net exports offset a drop in domestic demand. The domestic demand drop was due to weaker investment spending and a sharp drop in inventories, while private and government consumption edged up. Private consumption rose 0.2 percent while government consumption rose 0.1 percent on the quarter. Gross fixed capital formation fell 0.3 percent.
September seasonally adjusted merchandise trade surplus with the rest of the world was E5.2 billion compared to a surplus of E6.0 billion in August. Exports fell 2 percent and imports were down 1 percent on the month.
November flash harmonized index of consumer prices rose 2.1 percent when compared with last year, down from a rate of 2.4 percent in October. HICP is just above ECB's 2 percent price stability limit. The flash HICP report gives no details.
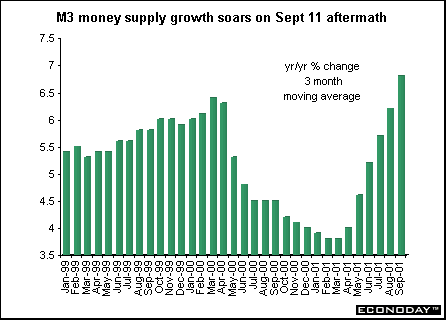
October seasonally adjusted M3 money supply growth rate jumped 7.4 percent when compared with last year. This pushed the moving average for the three months ending in October to 6.8 percent when compared with last year. This was up from 6.2 percent for the three months ending in September. The ECB's target rate for M3 money supply growth is 4.5 percent. The October M3 data are the first to be fully adjusted for non-eurozone resident holdings of money market shares/units, as well as for non-eurozone resident holdings of money market paper and securities with a maturity of less than two years. The ECB attributed the jump in M3 growth to financial market uncertainty following the September 11 terrorist attacks on the United States.
France - October producer price index fell 0.6 percent and 1.6 percent when compared with last year. Drops in energy and food prices were slightly offset by higher consumer and automobile prices. Excluding food and energy, the PPI remained unchanged but rose 0.6 percent on the year. Industry energy prices fell 3.3 percent on the month, with fuel prices down 7.7 percent after a 1.2 rise in September. October energy prices were down 13.9 percent on the year.
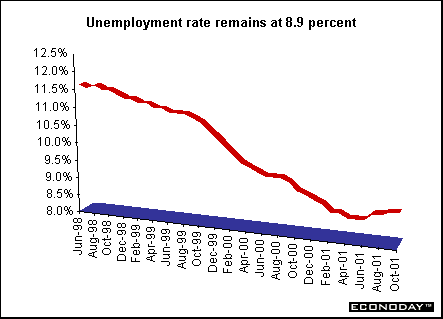
October unemployment rate remained unchanged at 8.9 percent even though the number of unemployed rose by 15,000. A year ago, the unemployment rate stood at 9.2 percent, according to the International Labor Organization definition, which excludes jobseekers that did any work during the month.
Italy - September unadjusted retail sales rose 0.4 percent on the year. The retail sales data are not adjusted changes in consumer prices. Ten of the 15 product categories rose. The September new seasonally adjusted retail sales index (published for the first time last month), showed September sales fell 0.2 percent on the month, with food sales down 0.2 percent and non-food sales down 0.1 percent.
October producer price index fell 0.4 percent and 0.6 percent on the year. The drop was due to lower oil prices. Producer prices excluding energy fell 0.1 percent but rose 0.9 percent on the year.
Asia
Japan - October seasonally adjusted retail sales dropped 2 percent and 4.9 percent when compared with last year. This was the biggest decline in six months.
October industrial production fell 0.3 percent to its lowest in more than 13 years. Makers of cell phones and other electrical machinery led last month's decline in production with a 2 percent drop. Producers of chip making devices, auto parts and mini-cars also lowered production. When compared with a year earlier, production fell 11.9 percent. October inventories fell 1.1 percent while shipments fell 0.4 percent.
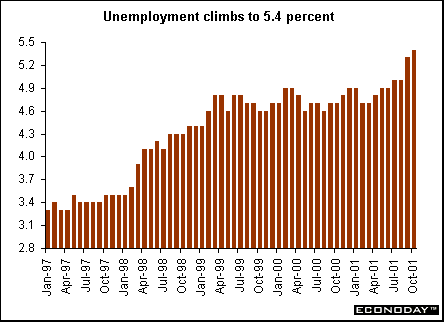
October unemployment rate rose to 5.4 percent, the highest since the government began keeping track in the 1950s. The number of people out of work rose to 3.6 million, the most since records were first kept in 1953. Manufacturing companies, which employ about a fifth of Japanese workers, cut 120,000 jobs last month. Transport and telecommunication firms shed 240,000 workers and the services industry cut 40,000. The total number of people working fell by 1.03 million from a year ago to 64.1 million, the biggest drop since 1974. Only 55 positions were available for every 100 applicants at government-run job agencies, down from September's 57.
October spending by households headed by a salaried worker rose 3.1 percent last month and increased 1.6 percent when compared with last year, the first gain in seven months.
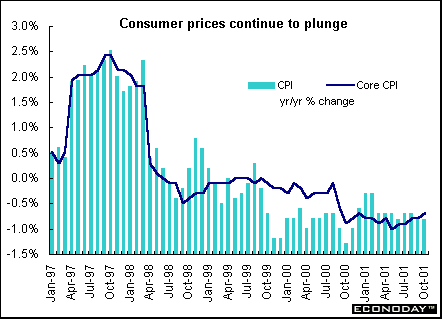
November Tokyo consumer prices excluding fresh food declined 0.2 percent and 1 percent from a year ago, the 26th drop from year earlier levels. Household appliances, travel and leisure led the decline. October nationwide prices excluding fresh food fell 0.7 percent from a year ago, the 25th straight drop. Overall consumer prices in Tokyo fell 1.4 percent when compared with last year while nationwide prices fell 0.8 percent from a year earlier.
Americas
Canada - October industrial product prices dropped 1.2 percent and were down 1.0 percent when compared with last year. Lower prices for petroleum and coal products and lumber products were the major contributors to this decline. Petroleum and coal product prices declined 17.1 percent on the year. If petroleum and coal product prices were excluded, the IPPI would have risen 0.3 percent instead of falling 1.0 percent.
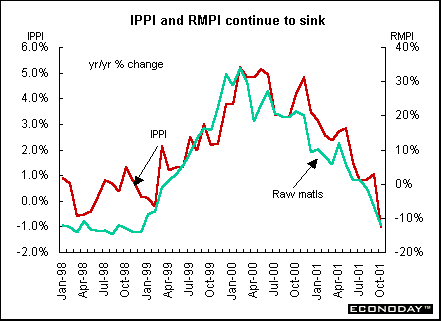
October raw materials price index sank 5.3 percent and plummeted 12.1 percent when compared with last year. Mineral fuels were responsible for most of the decline along with wood products and non-ferrous metals. If mineral fuels were excluded, the RMPI would have declined 4.3 percent in October when compared with last year instead of falling 12.1 percent. These drops were partly offset by higher prices for vegetable and animal products.
With the October 2001 data, Statistics Canada converted industrial product price and raw material price indexes to a 1997=100 base year and 1997 weighting pattern. The indexes are now classified using the 1997 North American Industrial Classification System (NAICS).
September real gross domestic product at basic prices fell 0.8 percent, one of the largest monthly declines since the recession of the 1980s. The goods producing sector fell by 1.5 percent while services declined 0.5 percent. Manufacturing output was down 2.1 percent, the largest monthly decline since the ice storm of January 1998. When compared with last year, manufacturing output was down 7.1 percent. Eighteen of 21 manufacturing groups, representing more than 75 percent of total output, reported declines.
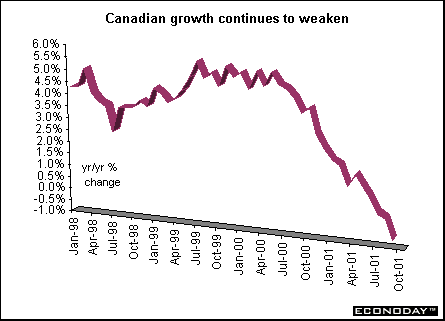
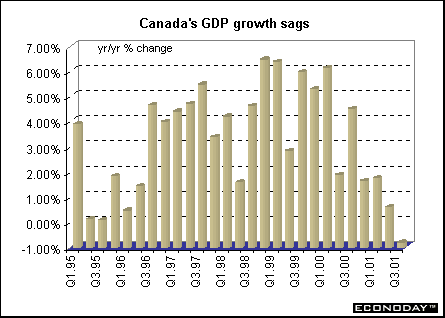
Third quarter gross domestic product fell 0.2 percent and at an annualized 0.8 percent rate when compared with last year. The decline was because of reduced consumer spending and weaker demand for exports. The quarterly decline ended a string of 23 consecutive quarters of growth. The last decline was 0.1 percent drop in the first quarter of 1991. Consumer spending declined for the first time since 1995, falling 0.1 percent. Exports fell 2 percent, the fourth straight quarterly decline. Business investment in machinery and equipment increased 3.1 percent.


Introduction • Global
Stock Market Indexes • Recap of Global Markets
• Currencies • Indicator
Scoreboard

The Bottom Line •
Looking Ahead
|