
Indicator scoreboard
EMU - August current account surplus was E4.2 billion, a sharp improvement from the deficit of E6.3 billion in August 2000. The improvement in the current account balance was caused mainly by an increase in the merchandise trade surplus to E6.0 billion from E200 million a year earlier, combined with a shift in the income balance to a surplus of E300 million from a deficit of E1.5 billion. The services surplus, at E800 million in August this year, was only slightly higher than the E500 million surplus a year ago.
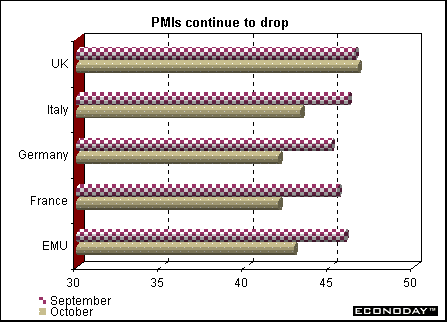
October Reuters purchasing managers index plunged to 42.9 from 45.9 in September. This was the seventh straight monthly decline and is a new record low. An index level below 50 means that the manufacturing sector has contracted. The further the index below 50, the faster the contraction. All PMI subindexes declined in October, as production, new orders, employment and input inventories fell to new historical lows. The eurozone PMI is based on results from Germany, France, Italy, Spain, Ireland, Austria, the Netherlands and Greece and is published by Reuters.
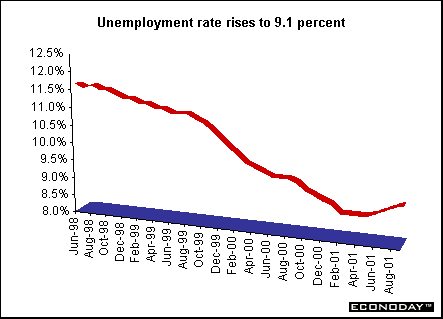
France -September unemployment rate rose to 9.1 percent from 9.0 percent in August. The number of unemployed rose for the fifth straight month. Since April, unemployment has climbed by 156,000 to 2.434 million, just 27,000 short of the level last September, when the unemployment rate was 9.4 percent, according to the ILO definition which excludes jobseekers who did any work during the month.
September producer prices inched up 0.1 percent after four months of decline, as higher energy prices offset lower agricultural prices. When compared with last year, the PPI was down 0.2 percent. Excluding food and energy the PPI was down 0.1 percent on the month but was up 0.9 percent on the year. Industry energy prices were up 1.2 percent but were still down 8.8 percent on the year. Food and agriculture prices fell 0.6 percent and were up 3.8 percent on the year.
Italy - September producer prices were up 0.1 percent and 0.4 percent when compared with last year. Excluding energy, the PPI was unchanged on the month but up 1.1 percent on the year. Intermediate goods prices rose 0.2 percent on the month but dropped 1.1 percent year on year. Consumer goods prices increased 0.2 percent on the month and rose 2.5 percent on the year, while investment goods were up 0.1 percent on the month, and climbed 1.2 percent on the year.
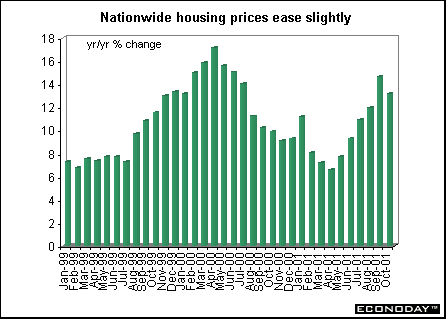
Britain - October Nationwide house price index fell 0.5 percent following a 2.8 percent increase last month, but was still up 13.1 percent when compared with last year. House prices have risen by nearly 3 percent in the three months through October.
Asia
Japan - September preliminary industrial production fell 2.9 percent on month. Production contracted about 4.3 percent for the July through September period, marking a third consecutive quarterly decline. Factory production fell to its lowest since 1994.
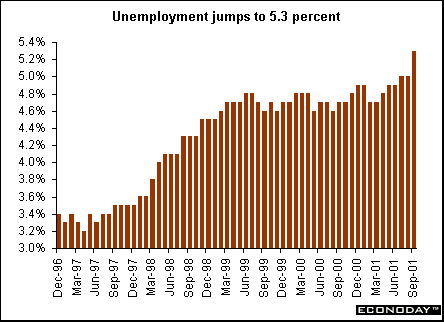
September unemployment rate jumped to 5.3 percent from 5 percent in August. It rose at its fastest pace in more than 34 years. Four hundred thousand jobs were lost. The increase in the jobless rate from 5 percent in August was the biggest since March 1967. Manufacturers, who employ about one in five Japanese workers, cut 220,000 jobs last month. People worked an average 41 hours a week, down 1 1/2 hours from August, and the lowest since at least February 2000. There were 57 jobs for every 100 applicants at state run job agencies last month, down from 59 in August and the lowest in 16 months.
September spending by families headed by a salaried worker rose 1.3 percent last month from August. But from a year earlier, spending fell 1.3 percent, the sixth drop. The propensity-to-spend ratio, which falls when people save more and spend less, dropped to 70.3 percent last month, the lowest since November 2000. Consumer spending makes up about 55 percent of the economy.
Americas
Canada - September industrial product price index rose 0.5 percent and 0.6 percent when compared with last year. Higher prices for motor vehicles and petroleum and coal products were partly offset by lower prices for meat products and lumber products. On the year, excluding petroleum and coal product prices, the IPPI rose 1.5 percent. From August to September, the value of the U.S. dollar strengthened against the Canadian dollar, pushing up prices of commodities that are quoted in U.S. dollars, notably automobiles. If the exchange rate had remained unchanged, the IPPI would have declined 0.1 percent instead of rising 0.5 percent. When compared with last year, the IPPI was up 0.6 percent, but without the exchange rate effect the IPPI would have fallen 0.9 percent.
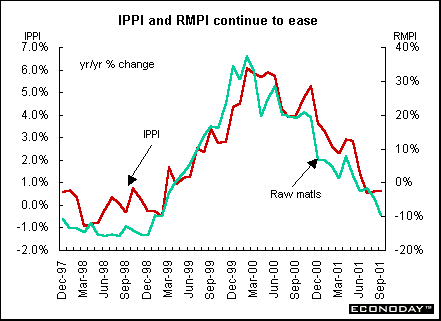
September raw material price index fell 2.4 percent. Lower prices for mineral fuels and animal products were somewhat offset by higher prices for non-ferrous metals. The RMPI fell 9.8 percent when compared with last year. Mineral fuels were responsible for more than half of the decline along with non-ferrous metals and wood products. If mineral fuels were excluded, the RMPI would have declined 3.9 percent when compared with last year.
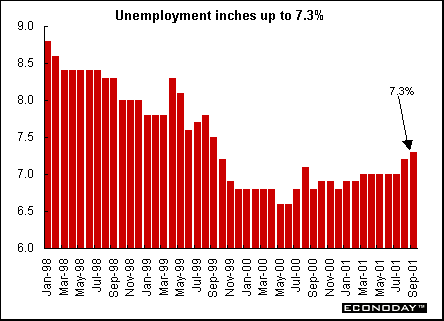
October unemployment rate inched up to 7.3 percent. October overall employment was essentially unchanged (up 1,800), a 28,000 increase in part time workers was offset by a 26,000 decline in full time workers. Employment in trade increased by 23,000, but manufacturing employment fell by 31,000. The largest decline was in computer and electronic products manufacturing.
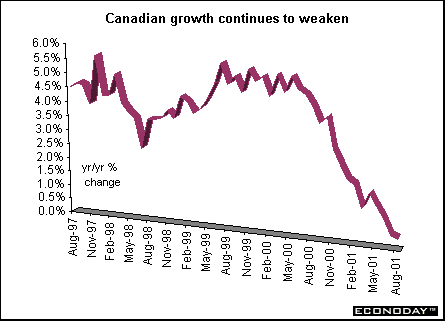
August real gross domestic product at factor cost rose 0.1 percent and 0.4 percent when compared with last year. Manufacturing, in decline since October 2000, edged up a marginal 0.1 percent but has dropped 4.6 percent when compared with last year. Growth in chemicals and paper helped offset continuing deterioration of the electronic products industry. The output of computers and electronic equipment fell 3.2 percent in August. Telephone equipment production was 59 percent lower than in August 2000. Motor vehicle assembly was down 1.5 percent in August, the eighth decline in 12 months. Auto parts production was up slightly. Heavy truck manufacturing fell a sharp 17.6 percent. Petroleum refinery output rose strongly, by 3.6 percent, due to stockpiling. Output of primary metals was down 1.2 percent because of sharp declines in the fabrication of non-ferrous metal products.
 |

Introduction • Global
Stock Market Indexes • Recap of Global Markets
• Currencies • Indicator
Scoreboard
The Bottom Line •
Looking Ahead
|