
Indicator scoreboard
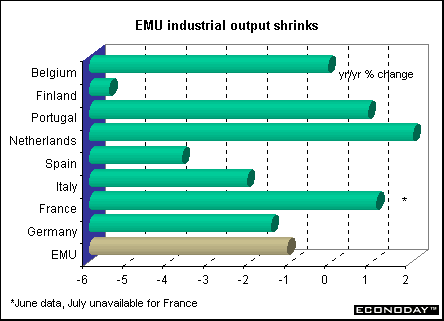
EMU - July industrial output fell 1.4 percent and was down 1.1 percent when compared with last year. Output declined in all sectors except energy. Durable consumer goods sank 2.2 percent and capital goods fell 1.3 percent. Intermediate goods fell 0.9 percent and non-durable consumer goods fell 0.4 percent
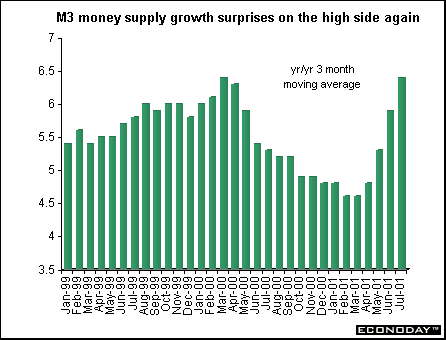
August seasonally adjusted M3 money supply rose 6.7 percent when compared with last year. The three month moving average for the months June through August rose 6.4 percent when compared with last year. This is considerably higher than the ECB's target growth rate of 4.5 percent. The data are adjusted for non-resident holdings of money market shares/units, but not for non-resident holdings of money market paper and securities with a maturity of less than two years. ECB estimated that the latter distorted M3 by about 0.75 percentage point. The ECB said that the relatively flat yield curve and recent stock market weakness might have contributed to the acceleration in M3 growth by making more attractive the holdings of short-term deposits and marketable instruments included in the M3 aggregate.
July non-seasonally adjusted merchandise trade surplus with the rest of the world was E7.8 billion, up 42 percent when compared with last year. The trade balance for June was revised up to a surplus of E6.0 billion from a surplus of E5.0 billion originally reported. Exports rose 9 percent on the year, while imports rose 4 percent.
Germany - August producer prices fell 0.1 percent and 2.7 percent when compared with last year. Oil product prices fell by 0.6 percent and 2.3 percent on the year. Excluding oil products prices, the PPI fell by 0.1 percent but rose 3.0 percent on the year. On the month, energy prices fell by 0.5 percent. Excluding all energy products, the overall PPI was unchanged and up 1.3 percent on the year. August seasonally adjusted producer prices fell 0.1 percent and 2.7 percent on the year, the same as the unadjusted rate.
August seasonally adjusted import prices fell 1.2 percent and were 0.9 percent below the year earlier level. Seasonally adjusted export prices fell 0.4 percent and rose 0.4 percent on the year.
France - July seasonally and calendar adjusted consumer spending on manufactured goods rose 1.4 percent and 2.7 percent when compared with last year. August seasonally and calendar adjusted spending was up 0.6 percent and 4.3 percent when compared with last year. Spending was boosted by car sales and bargain shopping for clothes and furniture. At the end of the two month period, spending was up 4.3 percent on the year.
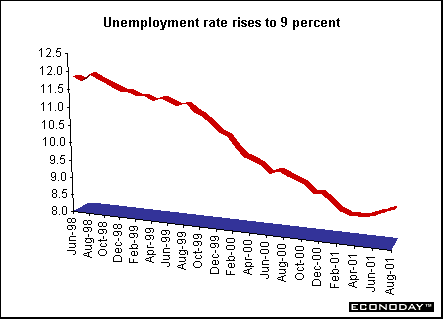
August unemployment rate rose to 9 percent. The number unemployed rose by 31,000, the fourth straight monthly rise according to the International Labour Organization definition, which excludes jobseekers who did any work during the month.
Italy - July seasonally adjusted unemployment rate fell to 9.4 percent from 9.6 percent in April to post its lowest level since January 1993. Employment surveys are carried out every three months (in January, April, July and October). There were around 127,000 more jobs in July than in April, a rise of 0.6 percent on a seasonally adjusted basis.
August merchandise trade surplus with non-EU countries rose to 2.946 trillion lire, when compared with a surplus of L2.702 trillion a year ago. Non-EU imports were down 4.0 percent while exports were down 1.9 percent.
July unadjusted retail sales rose 1.4 percent on the year. Pharmaceutical products were up 2.8 percent, followed by footwear and leather goods and cosmetic products.
July industrial orders edged down 0.2 percent when compared with last year. Domestic orders dropped 0.5 percent while foreign orders rose 0.4 percent. Domestic orders account for around 62 percent of the overall index, with foreign orders making up some 37 percent. The steepest declines product category came in the artificial and synthetic fibres sector and in the precision electrical appliances sector. The strongest gains were in the transportation and in the furniture sectors.
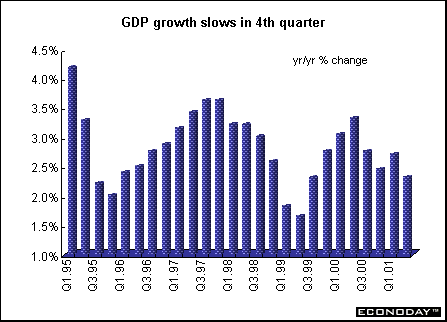
Britain - Second quarter gross domestic product was revised upward to 0.4 percent and 2.3 percent when compared with last year as construction and services output were estimated to have risen more rapidly than previously calculated. National Statistics revised up the level of GDP growth back to 1987 following key methodological changes and data improvements.
Asia
Japan - September seasonally adjusted Tokyo core consumer prices, which exclude fresh food, dropped 0.6 percent and 1.2 percent from a year earlier. This was the 24th straight drop. Including fresh food, consumer prices in Tokyo, fell 0.2 percent in September and 1.2 percent when compared with last year. August nationwide prices for all goods rose 0.4 percent in August but fell 0.7 percent on the year. Nationwide prices excluding food dropped 0.9 percent from a year ago.
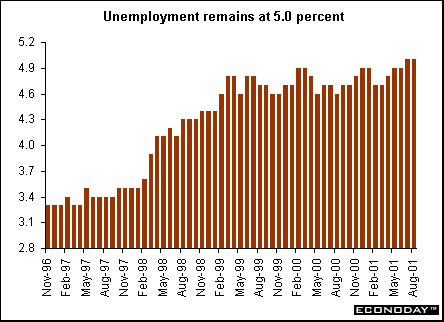
August unemployment rate remained at 5 percent, unchanged from July. Japan recorded its worst ever unemployment rate of 5 percent since the government began keeping track in 1953 in July.
August industrial production rose for the first time in six months, gaining 0.8 percent. But the still relatively weak performance suggests August's figure is just a temporary reaction to five straight months of drops and is unlikely to be sustained as manufacturers continue to scale back output amid slumping exports and weak domestic demand.
Americas
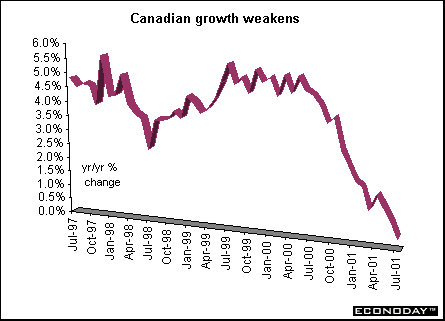
Canada - July gross domestic product at basic prices (formally called GDP at factor cost) slipped 0.1 percent after falling 0.2 percent in June. When compared with last year, GDP at basic prices rose 0.4 percent. Manufacturing output fell 0.5 percent following a 0.8 percent drop in the previous month. Reduced output in electronics and wood products led the drop in the sector. Of 21 major groups only seven, accounting 35.7 percent of output, advanced in July. Among the sectors showing an increase were machinery and equipment, auto parts, fabricated metals and oil refiners. With this release, Statistics Canada revised their monthly GDP at factor cost industry series. They moved them to NAICS, changing valuation from factor cost to basic prices, treating all spending on software as capital expenditures and re-based to 1997 Canadian dollars.
August industrial product price index (IPPI) was unchanged and rose 0.9 percent when compared with last year. Declining prices for primary metals, motor vehicles and pulp and paper products offset higher prices for petroleum and coal products and lumber products.
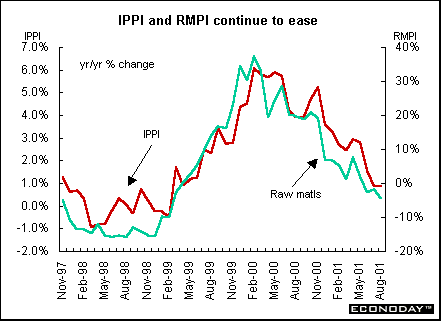
August raw materials price index (RMPI) fell 0.3 percent and 4.5 percent when compared with last year. Mineral fuels were responsible for close to half of the decline, along with decreases for wood products and non-ferrous metals. If mineral fuels were excluded, the RMPI would have declined 2.8 percent in August on the year instead of falling 4.5 percent. These decreases were somewhat offset by higher prices for animal and vegetable products.

Introduction • Global
Stock Market Indexes • Recap of Global Markets
• Currencies • Indicator
Scoreboard
The Bottom Line •
Looking Ahead
|