
Indicator scoreboard
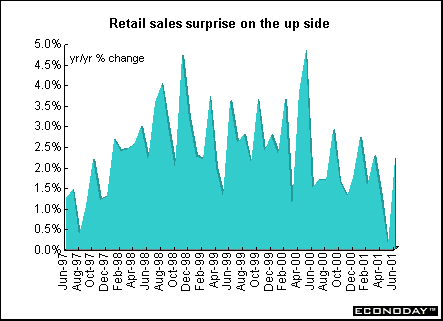
EMU - June inflation, seasonal and working day adjusted retail sales rose 0.6 percent and 2.1 percent when compared with last year. When compared with last year, the strongest increases were recorded for food, drink and tobacco, textiles, clothing and footwear, and household goods. Many analysts are reluctant to forecast EMU retail sales given the high volatility in the series and the various methodologies used in different countries to calculate retail sales.
August Reuters PMI services activity index fell to 52.3 from 53.2 in July. An index reading above 50 signals that activity is expanding, a reading below 50 that it is contracting. The higher the reading above 50, the stronger the growth. Every subindex fell with the exception of business expectations, which rose to 62.0 after 61.3. But the employment and new business subindexes fell to their lowest levels in the history of the release, with new business at 49.9 and thus showing contraction. Outstanding business fell to the lowest level since February 1999 to stand at 48.3 after 49.1. The composite index combining the service and industrial sector PMIs fell to 50.7 from an upwardly revised 51.1 in July. While still showing expansion, this is the lowest in the survey's history. All components of the composite index declined.
June merchandise trade surplus with the rest of the world was E5.0 billion, double the surplus of E2.5 billion a year earlier. The trade balance for May was revised down to a surplus of E0.6 billion from a surplus of E1.7 billion reported originally. In June, exports rose 9 percent on the year, while imports rose 3 percent.
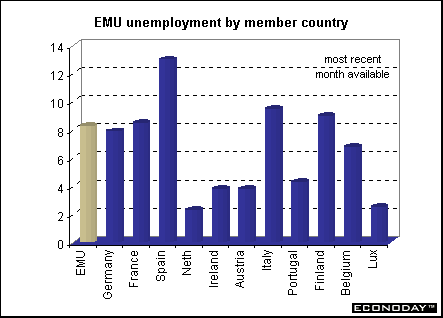
July seasonally adjusted unemployment rate remained unchanged at 8.3 percent. Of the nine EMU states reporting data, unemployment fell in one, rose in two and remained unchanged in six. Spain continues to show the highest unemployment rate at 13.0 percent. This was followed by Finland (9.0 percent), France (8.5 percent), Germany (7.9 percent) and Belgium (6.8 percent). Luxemburg showed the lowest unemployment rate in July (2.5 percent) followed by Ireland (3.8 percent), Austria (3.8 percent) and Portugal (4.3 percent)
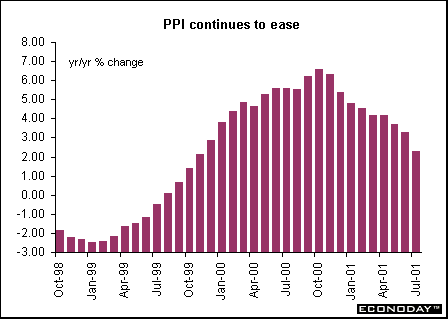
July industrial producer prices (excluding the construction sector) fell 0.4 percent but rose 2.3 percent on the year. The decline was mainly due to lower energy prices. Energy prices fell 1.4 percent but still rose 4 percent on the year. Intermediate goods prices fell 0.2 percent, the fourth drop in five months. On the year, intermediate goods prices rose only 0.8 percent. Capital goods, durable consumer goods and non-durable consumer goods prices all rose 0.1 percent on average on the month. Capital goods were up 1.1 percent when compared with last year.
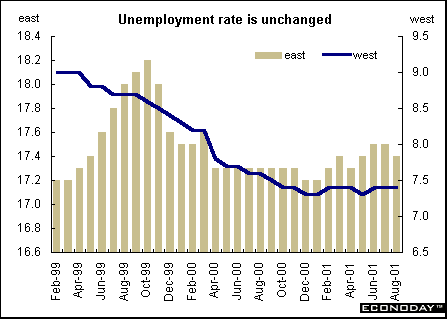
Germany - August seasonally adjusted pan-German unemployment rate was unchanged at 9.3 percent. West German unemployment rate also was unchanged at 7.4 percent but unemployment rate fell to 17.4 percent from 17.5 percent in east Germany. August seasonally adjusted number of unemployed fell for the first time this year due in large part to the earlier than usual end to the summer holidays in some east German states. Pan-German seasonally adjusted unemployment fell 2,000, as a 7,000 decline in east German joblessness offset a 5,000 increase in the west. June payroll jobs continued to shrink in June (employment data lag two months behind unemployment data), down 14,000, after a 16,000 drop in May.
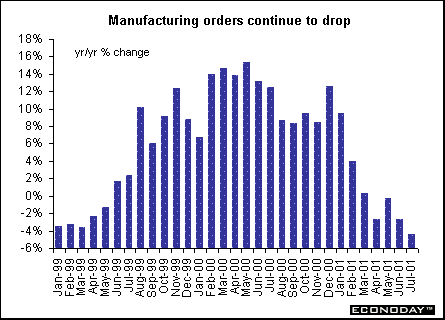
July pan-German manufacturing orders dropped 1.4 percent as a decline in foreign demand offset a rise in domestic orders. Manufacturing orders are now 4.4 percent below the level of a year earlier. Orders declined 1.9 percent in west Germany but rose 2.7 percent in east Germany. A revision of the July figures is likely because of under reporting by companies on summer holiday. Domestic orders were up 1.1 percent but foreign orders declined 4.3 percent. Capital goods orders were down 2.0. Foreign demand in this sector plunged 7.1 percent more than offsetting a 4.2 percent rise in domestic demand.
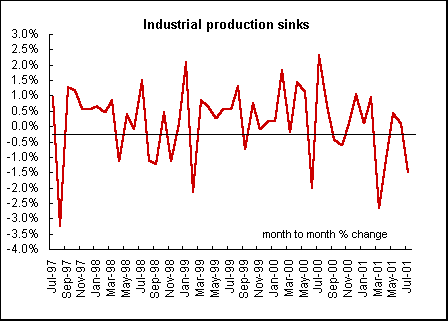
July seasonally adjusted pan-German industrial production fell 1.5 percent. The sharp decline was probably due in part to a correction to output gains in the preceding two months. However, the size of the fall in July might have been exaggerated by the above average number of summer vacation days in the reporting month. All major production subcategories fell with the exception of construction, up 0.3 percent and energy, up 3.5 percent. The manufacturing sector, which accounts for more than 85 percent of industrial output, sank 2.1 percent. Capital goods output fell 2.5 percent while that of intermediate goods was down 2.3 percent. Consumer goods output fell 1.4 percent with durable goods dropping 2.1 percent and non-durables falling 1.1 percent. July seasonally adjusted industrial production excluding construction fell 1.6 percent after rising 0.3 percent in June.
Italy - July non-EU merchandise trade surplus was L2.799 trillion compared with a L2.865 trillion surplus a year ago. July's non-EU imports were up 6.4 percent while exports were up 5.2 percent when compared with last year. June EU merchandise trade deficit was L843 billion compared with a deficit of L42 billion in June 2000. June EU exports rose 1.5 percent and imports were up 4.8 percent on the year. June world trade surplus was L885 billion with imports rising 5.5 percent and exports up 7.1 percent when compared with last year.
Britain - August seasonally adjusted Nationwide building society house price index rose 0.4 percent, following a 1.1 percent increase last month and a 1.9 percent rise in June. The annual housing price increase rose to 11.9 percent from 10.9 percent in July.
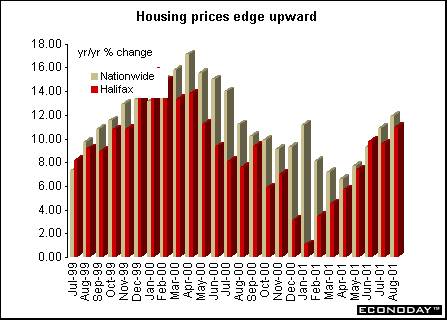
August seasonally adjusted Halifax house price index rose 1.5 percent and was up 10.9 percent on the year. This followed strong growth in July, when prices rose 0.7 percent on the month and 9.6 percent on the year.
August Chartered Institute of Purchasing and Supply (CIPS) business activity index rose to 50.9 from 50.3 in July. Expectations for the future declined to 69.1 from 70.5 last month. This was the weakest reading since December 1998. The incoming new business balance slipped to 49.3 in August from 50.8 last month, the first time this index has dropped below the break even 50 level since February 1999.
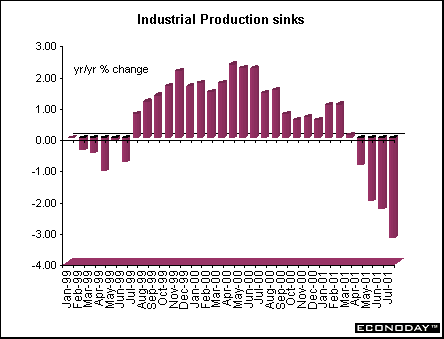
July manufacturing output fell 0.9 percent and was down 3.0 percent when compared with last year. The annual rate is now at its lowest rate since January 1992. Most of the decline this month was concentrated in the electrical and optical equipment industries, with output declining 4.1 percent on the month. July industrial production fell 0.5 percent on the month and was down 3.2 percent on the year.
Asia
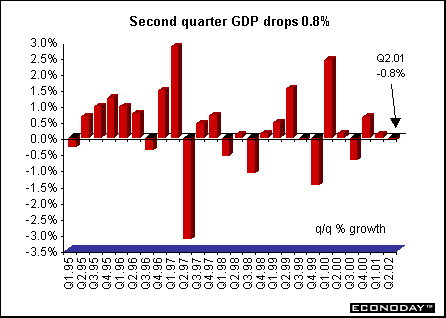
Japan - Second quarter real gross domestic product fell 0.8 percent and 3.2 percent on an annualized basis. Private consumption rose 0.5 percent on quarter, while capital spending fell 2.8 percent on quarter. Public investment fell 4.1 percent in the period. Although the data is obviously weak, Japan avoided falling into recession (technically defined as two consecutive quarters of negative growth) because of the recent revision of first quarter data to a 0.1 percent increase from the originally reported 0.2 percent drop.
Americas
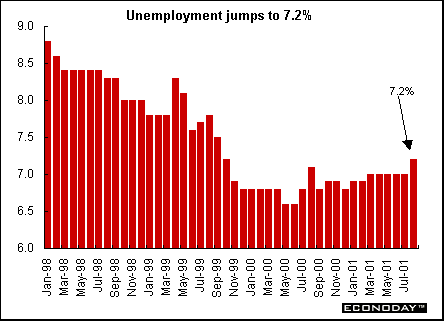
Canada - August unemployment rate rose to 7.2 percent from 7 percent in July. Employment edged down by an estimated 7,700 jobs in August. This was the third month of job losses. However, full time employment rose by 41,300 while part time employment fell by 49,100. Employment declines over the last three months were concentrated in service-producing industries, with losses of 37,000. Employment in goods-producing industries was virtually unchanged over the period. Employment in professional, scientific and technical services fell by 18,000 in August, bringing losses over the last four months to 66,000.


Introduction • Global
Stock Market Indexes • Recap of Global Markets
• Currencies • Indicator
Scoreboard

The Bottom Line •
Looking Ahead
|