
Indicator scoreboard
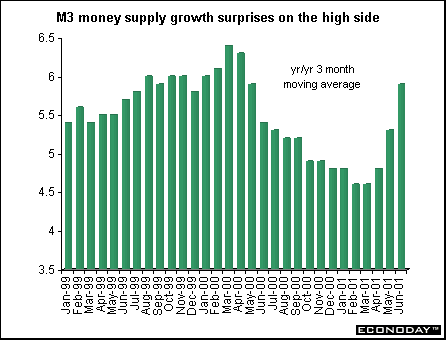
EMU - Seasonally adjusted M3 money supply for the three months May through July rose 5.9 percent when compared with the same three months last year. July M3 money supply rose 6.4 percent when compared with last year. The ECB said that the flat yield curve and recent stock market weakness might have contributed to the acceleration in M3 growth in July. The ECB estimated that the distortion caused by foreign holdings of money market paper and debt securities with a maturity of less than two years - which have risen sharply due to investor uncertainty - may have pushed up M3 by about 0.75 percentage point. Adjusted for this distortion, the M3 three month year over year growth rate stands at about 5.1 percent, above the ECB's 4.5 percent growth reference rate for this year.
August Reuters Purchasing Managers' Index rose to 47.6 from 47.3 in July. Anything above 50 indicates expansion and below 50, contraction; the greater the divergence from 50, the greater the rate of change. The indexes in Germany, Italy and France rose, though they all remained below 50. The output index rose to 48.3 from 47.9 in July, while the new orders index rose to 47.1 from 46.2 in July. Both the production and new orders indexes posted their first increases since June 2000, but the sub-50 levels indicate that these categories continued to decline, albeit at a slower pace. The eurozone PMI is based on results from Germany, France, Italy, Spain, Ireland, Austria, the Netherlands and Greece. The purchasing managers' indexes, originally due for release Monday, were released early by mistake.
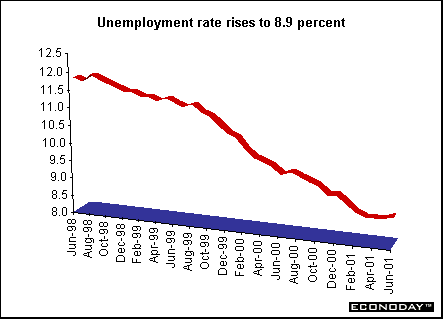
France - July seasonally adjusted unemployment rate rose to 8.9 percent from 8.8 percent in June. The number of unemployed persons rose by 57,000. This was the third straight month in which the number of unemployed increased.
Italy - August preliminary harmonized index of consumer prices (HICP) were unchanged and up 2.8 percent on the year, the same as the national price index released earlier. The unchanged result is the lowest since August last year. The preliminary data is based on 71 percent of the cities and 78 percent of the population.
June unadjusted retail sales jumped 2.9 percent when compared with last year. Retail sales data are measured in nominal value terms and therefore not adjusted for consumer price increases. Retail sales rose for all 15 product categories. The strongest rises were posted by pharmaceutical products, up 5.5 percent, followed by footwear and leather goods, up 3.2 percent.
July producer prices fell 0.4 percent but rose 1.4 percent when compared with last year. The drop was due to the decline in energy prices. Excluding energy, the PPI would have been flat but would have posted the same 1.4 percent increase on the year.
Asia
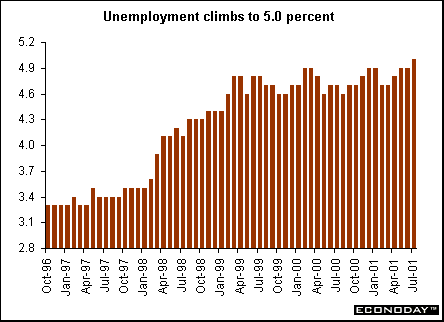
Japan - July unemployment rate climbed to a record 5 percent from 4.9 percent in June and triggered government subsidies to companies that hire unemployed people. A record 3.38 million people were unemployed. There were 60 jobs available for every 100 applicants at state run job centers, down from 61 in June. While most of the job losses in the past year have been in the construction and agricultural industries, cuts are now spreading to some of Japan's best known technology companies. Manufacturers and service industries shed 290,000 jobs. Companies are hiring more part time workers than full time workers. Japan's jobless rate had never hit the 5 percent level since the government began compiling such statistics in 1953. The unemployment rate for men was 5.2 percent, a record high and up 0.1 percent from June. The rate stood at 4.7 percent for women.
July seasonally adjusted sales at department stores, supermarkets and convenience stores fell 0.6 percent and dropped 2.7 percent from a year ago, the sixth straight decline. Clothing sales at all retailers fell 2.8 percent. July large retailers seasonally adjusted sales fell 2.8 percent, after a 0.4 percent decline in June. From a year ago, sales fell 1.6 percent, extending a skid that began more than three years ago.
July seasonally adjusted industrial production fell 2.8 percent and was 8 percent lower than a year ago. This was the fifth straight month of decline.
August Tokyo overall consumer price index declined 0.9 percent. Core CPI dropped 1.2 percent on the year, reflecting faster rates of declines for housing rents in the capital than the rest of the country. July nationwide consumer prices fell 0.8 percent on the year. Core consumer prices excluding food fell 0.9 percent from a year earlier. The Ministry of Public Management has revamped the CPI data aiming to more accurately capture price trends. The new standards for measuring consumer prices incorporate price changes for items such as personal computers and mobile-phone charges - both of which have fallen sharply in recent years. A ministry official said the changes resulted in lowering the nationwide consumer price index by an average of 0.3 percent for the months from January through July.
Hong Kong - Second quarter seasonally adjusted gross domestic product fell 1.7 percent from the previous quarter as an export slump deepened and spending by companies and consumers stalled. First quarter growth was revised to zero from 0.3 percent, meaning the city narrowly escaped recession. From a year ago, second quarter GDP grew 0.5 percent, the smallest gain since the first quarter of 1999, when Hong Kong was in recession. Exports, about half of which are China made goods on their way to other places, fell 5 percent in the second quarter from the first, more than double the first quarter's decline. In contrast, last year, exports rose 20 percent. Investment spending rose 0.4 percent from the second quarter, compared with an 11.5 percent gain in the first quarter, as purchases of machinery and equipment slowed. Consumer spending rose 1.1 percent from the first quarter, compared with a 5.9 percent increase in the first three months of the year.
Americas
Canada - July industrial product price index (IPPI) fell 0.6 percent but rose 0.9 percent when compared with last year. Lower prices for petroleum and coal products accounted for most of the downward pressure. Price decreases for lumber, pulp and primary metal products also contributed to the monthly decline. Petroleum and coal product prices declined 6.8 percent on the year. Excluding these prices, the IPPI would have risen 1.6 percent instead of 0.9 percent when compared with last year.
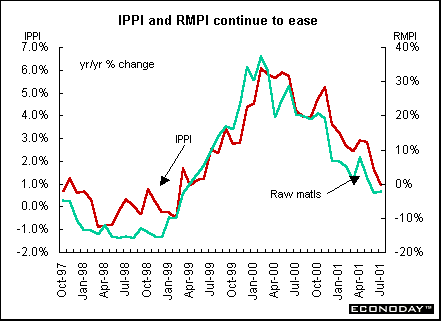
July raw materials price index fell 1.7 percent. Falling mineral fuels and non-ferrous metals prices were the major contributors to the decline. When compared with last year, the RMPI fell 2 percent. Mineral fuels were responsible for most of the decline along with decreases for wood products and non-ferrous metals. If mineral fuels were excluded, the RMPI would have fallen 1.0 percent on the year instead of dropping 2.0 percent. These decreases were partly offset by higher prices for animal and vegetable products.
In July the value of the U.S. dollar strengthened against the Canadian dollar, pushing up prices of commodities that are quoted in U.S. dollars, notably automobiles. The impact on the IPPI was such that if the exchange rate had not changed the IPPI would have declined 0.9 percent instead of 0.6 percent. When compared with last year, the IPPI rose 0.9 percent but without the exchange rate effect the IPPI would have edged down 0.2 percent.
Second quarter gross domestic product rose 0.1 percent, slowing from the 0.5 percent increase in the first quarter. This was the slowest rate of growth since the third quarter of 1995. When compared with last year, GDP rose 2.1 percent. Second quarter business investment rose 0.7 percent, but businesses continued to reduce their expenditures on computers and other related equipment. After falling in the first quarter, business investment in inventories resumed, but at lower levels than before. Exports declined for the third consecutive quarter. Corporate profits, stated on a nominal basis, fell 1.6 percent, the first drop in three years. Net government expenditure on goods and services was up 0.8 percent, following a similar increase in the first quarter.
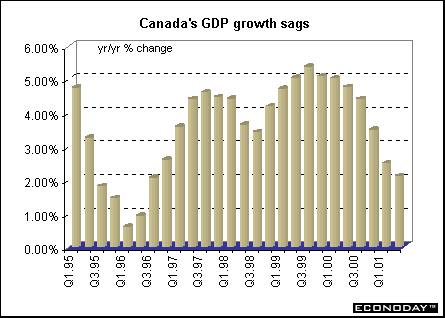
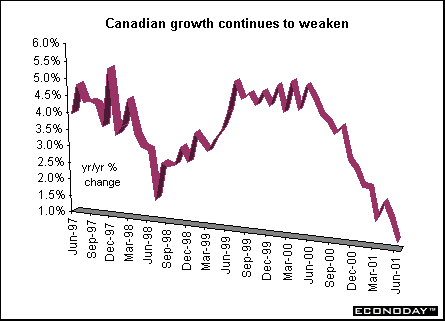
June real gross domestic product at factor cost fell by 0.2 percent, largely erasing a 0.3 percent gain in May. When compared to last year, GDP at factor cost rose 1.2 percent. June total factory output fell 1.0 percent after a 0.7 percent increase in May. This was mainly due to deeper cuts in production by manufacturers of electronic products, a drop of 5.8 percent in June. Producers of paper and allied products and lumber also reduced output significantly, and automotive production fell back slightly. There was widespread weakness as 14 of 22 major industry groups, which accounted for 52.3 percent of total manufacturing production, declined in June. These decreases were partly offset by gains in aircraft, chemicals and plastics manufacturing.


Introduction • Global
Stock Market Indexes • Recap of Global Markets
• Currencies • Indicator
Scoreboard

The Bottom Line •
Looking Ahead
|