
Indicator scoreboard
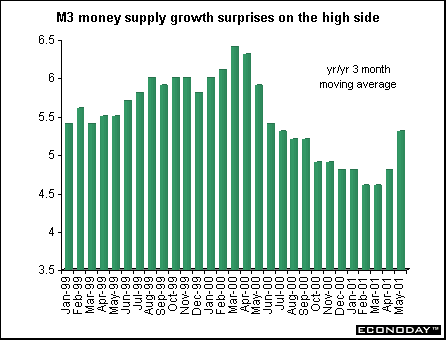
EMU - M3 money supply for the three months through June jumped 5.3 percent when compared with last year. June M3 rose 6.1 percent when compared with last year. The data are adjusted for non-euro zone resident holdings of money market shares or units, but not for non-euro zone resident holdings of money market paper and securities with a maturity of less than two years. M3 growth has accelerated four months in a row, with the annual rate well up from 4.4 percent in February. The 6.1 percent year over year growth rate was the highest since April 2000. At the same time, the ECB said, the upward distortion to M3 growth caused by non-euro zone residents' holdings of money market paper and debt securities with a maturity of up to two years may have contributed by around 75 basis points to annual M3 growth.
May merchandise trade surplus with the rest of the world was E1.7 billion, E700 million above the E1.0 billion surplus in May 2000. May seasonally adjusted trade surplus, released for the first time was E1.7 billion. In May, EMU exports rose 2 percent while imports declined 1 percent when compared with last year. When compared with last year, imports of primary products rose 7 percent and manufactured goods imports increased 12 percent. Exports of manufactured goods increased by 15 percent, but those of primary products increased only by 4 percent. Exports of machinery and vehicles surged 18 percent.
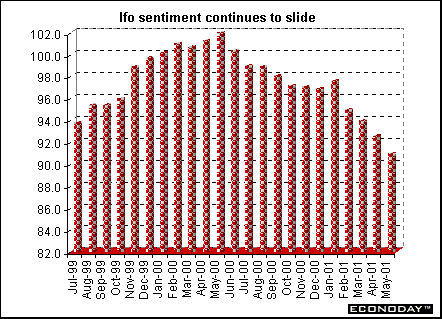
Germany - June Ifo Institute's west German business sentiment index fell to 89.5, its lowest level in almost five years and the twelfth monthly decline in thirteen months. In west Germany, current conditions index declined to 85.5 from 86.8 in May while the business expectations index dropped to 93.6 from 94.9 in May. In east Germany, overall business sentiment fell to 102.1 from 104.7 in May. Current conditions sank to 1231.2 from 125.4 and business expectations fell to 84.1 from 85.3.
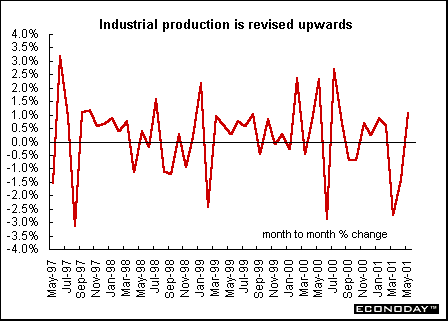
May industrial production was revised up to 1.1 percent from an originally reported gain of 0.9 percent. West German industrial production was revised up to 1.0 percent from 0.7 percent but east German industrial production was revised down from a gain of 3.2 percent to an increase of 2.9 percent. Manufacturing output was revised up to 1 percent from the originally reported increase of 0.4 percent.
June producer price index rose 0.1 percent and 4.3 percent when compared with last year. Producer prices excluding oil were up 0.1 percent on the month and 4.2 percent on the year. Prices for manufacturing goods were unchanged on the month and up 1.9 percent on the year. June manufacturing goods excluding oil were up 0.1 percent and 1.8 percent on the year. June seasonally adjusted producer prices rose 0.2 percent on the month and 4.3 percent on the year.
June seasonally adjusted import prices rose 0.2 percent and 3.7 percent when compared with last year. Seasonally adjusted export prices remained flat on the month and rose 1.6 percent on the year. Non-seasonally adjusted import prices fell 0.3 percent on the month but rose 3.6 percent on the year.
France - June final harmonized index of consumer prices rose 2.2 percent when compared with last year. June seasonally adjusted consumer price index rose 0.1 percent and 2.2 percent when compared with last year. Prices eased from May thanks to declining energy and fresh food prices. Core inflation rate, which excludes administered prices, volatile sectors like food and energy, and tax effects, rose 0.1 percent and 1.5 percent when compared with last year.
June seasonally and workday adjusted consumer spending on manufactured goods rose 1.5 percent, thanks to a rebound in car and clothing sales. Second quarter spending grew only 0.2 percent compared 1.5 percent in the first quarter, signaling a clear slowdown in the main component of domestic demand. Outlays for manufactured goods account for 25 percent of total household sending. Excluding autos, parts and pharmaceuticals, spending on manufacturing goods was up 1.5 percent after a 1.0 percent decline in May.
Italy - June non-EU merchandise trade surplus was 1.627 trillion lire, compared with a L222 billion surplus in June 2000. Non-EU imports were up 6.0 percent while exports were up 13.6 percent when compared with last year. May EU trade surplus was L365 billion compared with a deficit of L814 billion in May 2000. May EU exports rose 5.7 percent and imports were up 0.7 percent when compared with last year. May world trade deficit was L1.005 trillion, with imports rising 1.7 percent and exports up 7.0 percent.
May unadjusted retail sales rose 1.8 percent on the year. Retail sales posted gains in all 14 components. The strongest increases were posted by pharmaceutical products, up 4.3 percent, and other items, such as watches and jewelry, up 2.3 percent.
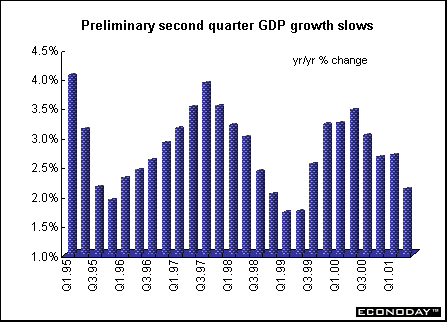
Britain - Second quarter preliminary estimate of gross domestic product rose 0.3 percent and 2.1 percent when compared with last year. The quarterly increase was the lowest since the fourth quarter of 1998, while the annual rise was the weakest since the second quarter of 1992. Service sector output was up 0.6 percent on the quarter, compared with a quarterly increase of 0.9 percent in the first quarter. Annual output was up 3.4 percent in the second quarter. Manufacturing output is estimated to have fallen significantly in the second quarter, with output in high tech industries down sharply. Agricultural output fell during the quarter due to the impact of the foot and mouth crisis.
Asia
Japan - June seasonally adjusted large retailers' sales dropped 0.4 percent after rising 0.3 percent in May. Sales fell 1.3 percent in the three months ended June 30 from the previous quarter reinforcing expectations the economy shrank for a second consecutive quarter. Total retail sales, including smaller chains and convenience stores, were unchanged in June and fell 3.6 percent in the second quarter. They fell 2.7 percent from a year earlier. Sales at convenience stores rose 5.1 percent last month from a year ago. Sales are expected to gain this month as the hottest July on record helps boosts sales of cold drinks, ice cream and noodles. Department store sales rose 0.1 percent but fell 1.6 from a year earlier. Sales at general merchandisers fell 0.7 percent and 4.8 percent from a year ago. At stores open at least a year, sales fell 1.9 percent from June of last year.
The trade surplus fell to 3.2 trillion yen ($25.9 billion) in the six months ended June 30, down 44 percent from the first half of last year. This is the biggest decline since records were first kept in 1947. Exports fell 0.1 percent in the first half of the year from a year earlier as sales of ships, cars and electronics fell. Imports rose 13 percent as the weaker yen pushed up energy costs and Japanese companies bought goods, like clothes, from China, where production costs are lower than at home. June seasonally adjusted trade surplus more than doubled last month to 651.1 billion yen from an eight year low 287.8 billion yen in May, when many firms closed for a week of holidays. Imports fell 13 percent and exports dropped 3.3 percent as companies imported less semiconductor and other production equipment, cutting back on output of chips for export in the face of waning worldwide demand.
July Tokyo consumer prices, excluding fresh food, were unchanged but fell 0.9 percent when compared with last year. Clothing and entertainment costs fell. Including fresh food, July seasonally adjusted consumer prices in Tokyo fell 0.1 percent. June nationwide prices, excluding fresh food, fell 0.6 percent from a year earlier. June nationwide prices for all goods fell 0.1 percent.
Australia - Second quarter consumer prices increased 0.8 percent from the previous quarter, following a 1.1 percent gain in the first quarter. Consumer prices rose 6 percent in the second quarter from the same period a year ago. While that is double the top of the central bank's 2 percent to 3 percent target for annual inflation, it includes the impact of a 10 percent goods and services tax introduced in July last year.
Americas
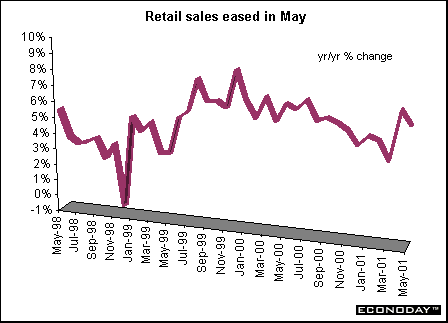
Canada - May seasonally adjusted retail sales rose 0.2 percent following a 1.8 percent increase in April. In constant dollars, sales fell 0.3 percent from April. The slight increase was mainly due to higher prices for gasoline, cigarettes and fresh fruit. Compared with a year earlier, total retail sales were 6.2 percent higher. Sales remained unchanged in the automotive and furniture sectors and were down 3.2 percent in clothing stores and 0.4 percent in general merchandise stores
June industrial product price index slipped 0.9 percent but rose 1.7 percent when compared with last year. Prices for motor vehicles, petroleum and coal products, pulp and newsprint were the major factors behind this decline. If the impact of petroleum and coal product prices were excluded, the IPPI would have gained 1.8 percent instead of 1.7 percent on the year.
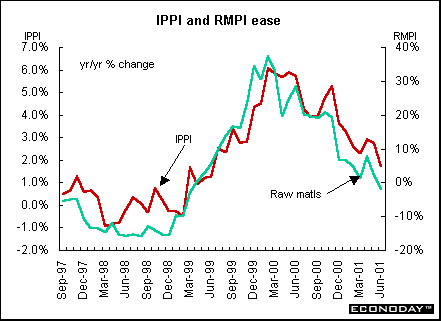
June raw materials prices were down 1.6 percent and 1.9 percent when compared with last year. Falling prices for mineral fuels, animal products and non-ferrous metals were the major contributors to the decline. If mineral fuels were excluded, the RMPI would have risen 0.2 percent when compared with last year instead of declining 1.9 percent. These decreases were partly offset by higher prices for animals and animal products and vegetable products.
In June the value of the U.S. dollar weakened against the Canadian dollar, pushing down prices of commodities that are quoted in U.S. dollars - notably automobiles, pulp and newsprint. The impact on the IPPI was such that if the exchange rate had remained unchanged, the IPPI would have declined 0.4 percent instead of 0.9 percent. On a 12-month basis, the influence of the dollar was also evident. Without the exchange rate effect, the IPPI would have risen 0.9 percent rather than 1.7 percent from June 2000 to June 2001.

Introduction • Global
Stock Market Indexes • Recap of Global Markets
• Currencies • Indicator
Scoreboard
The Bottom Line •
Looking Ahead
|