
Indicator scoreboard
Germany - April seasonally adjusted real retail sales (excluding auto dealerships, petrol stations and wholesale warehouses) soared 5 percent but fell 0.7 percent when compared with last year. The 5.0 percent seasonally adjusted month over month increase was the largest in eight years. April real seasonally and calendar adjusted retail sales including autos and petrol rose 1.8 percent but fell 0.9 percent when compared with last year. April results were helped by strong Easter sales.
May pan-German unadjusted final consumer prices were up 0.5 percent, while the annual rate rose to 3.5 percent. Final May data for the harmonized CPI was up 0.6 percent and 3.6 percent when compared with last year. Excluding oil products, May CPI rose 2.9 percent when compared with last year.
April seasonally adjusted merchandise trade surplus was E5.0 billion, down from a E8.2 billion surplus in March but the same as in April 2000. Seasonally adjusted exports were up 2.5 percent and 13.6 percent on the year. Imports stood were up 10.2 percent and 15.7 percent on the year.
May wholesale prices rose 0.5 percent and 4 percent when compared with last year. Excluding oil products, wholesale prices rose only 0.1 percent and 3.0 percent when compared with last year. The monthly increase was led by higher prices for light heating oil, up 3.6 percent, citrus fruits, up 9.4 percent and raw coffee, up 2.3 percent. Excluding seasonal food prices, wholesale prices rose 0.6 percent and 3.4 percent on the year.
France - EMU harmonized consumer price index surged 0.7 percent and to a record annual rate of 2.5 percent on rising food, energy and new car prices. Seasonally adjusted CPI rose 0.6 percent for an annual increase of 2.3 percent. Fresh produce prices rose 9.1 percent when compared with last year because of bad weather. Oil prices jumped 3.5 percent on the month and gas prices rose 9.0 percent. Excluding energy, the CPI was up 0.4 percent on the month and 2.2 percent higher on the year. On the positive side, the seasonally adjusted monthly core inflation rate, which excludes administered prices, volatile sectors like food and energy, and tax effects, slowed to an increase of 0.1 percent on the month and 1.5 percent when compared with last year.
April seasonally and workday adjusted manufacturing output declined 0.7 percent but was up 2.2 percent when compared with last year. Auto production plunged and semi-finished and capital goods continued lower. Total industrial output declined 0.3 percent and 1.9 percent when compared with last year.
April seasonally adjusted merchandise trade balance fell to a deficit of E483 million as the drop in exports, especially to the United States, outpaced the decline in imports. Exports fell 6.0 percent as previous gains in the aerospace, naval and pharmaceutical sectors waned, revealing the weakness in other sectors. Exports declined to all regions except the Middle East. Trade deficits widened with the eurozone, but also Japan and the U.S. The fall in imports slowed to 1.5 percent.
Italy - April seasonally and workday adjusted industrial production dropped 1.9 percent and 1.8 percent on the year. Consumer goods' output fell 1.2 percent on the month and rose an unadjusted 5.1 percent on the year. Output of investment goods shed an adjusted 3.7 percent on the month, up an unadjusted 5.3 percent on the year, while intermediate goods dropped by 1.6 percent on the month, rising 1.0 percent on the year.
Spain - April workday adjusted industrial production fell 1.5 percent when compared with last year. Consumer goods were down an adjusted 3.4 percent but capital goods gained a hefty 5.1 percent. Intermediate goods fell 2.2 percent.
Britain - May seasonally adjusted producer input prices jumped 1.4 percent and 4.7 percent when compared with last year as the cost of crude oil jumped during the month. On an unadjusted basis, input prices rose 2.2 percent on the month. The cost of crude oil rose 13.4 percent and 9.7 percent on the year. Non-seasonally adjusted output prices rose 0.3 percent. Seasonally adjusted core output prices (excluding food, beverages, tobacco and petroleum) rose by 0.1 percent on the month, leaving the annual inflation rate steady at 0.3 percent.
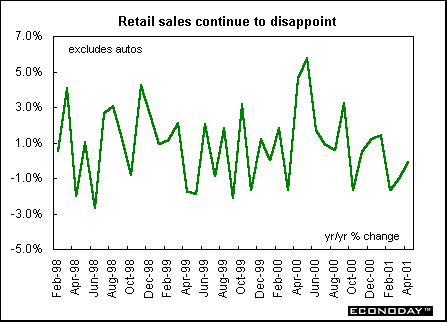
May retail price index (RPI) rose 0.6 percent and 2.1 percent when compared with last year. The RPIX, which excludes mortgage interest payments, rose 0.8 percent and 2.4 percent when compared with last year. This was the highest annual rise since March 1999. The RPIX is only slightly below the Bank of England's 2.5 percent inflation target. RPIX inflation was driven higher by a huge increase in seasonal food prices, which rose by 12.7 percent and 24.5 percent above levels a year earlier. Wet weather and poor growing conditions had hampered planting and harvesting, pushing up the cost of fresh vegetables. Another strong upward effect came from a rise in motoring costs, bumped up mainly by an increase in the cost of petrol. RPIY, which excludes both mortgage interest payments and indirect taxation rose 0.9 percent on the month and 2.8 percent on the year.
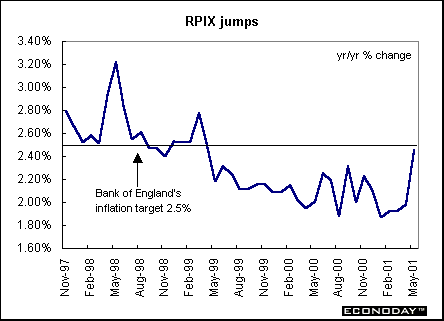
May unemployment claimant count rate remained unchanged at 3.2 percent. ILO unemployment fell by 65,000 in the three months to April. The rate of unemployment declined to 5.0 percent, down from 5.2 percent in the previous three months. Data continued to show declines in unemployment with the rate falling to its lowest levels since records began in 1984.
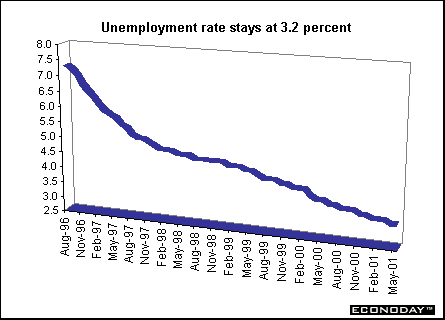
Average earnings growth rose to 5.2 percent in the three months to April, following a revised 5.0 percent rate in the three months to March. In April alone, earnings were up 4.7 percent compared to levels a year earlier and up from a 4.3 percent figure in April. Headline average earnings were boosted further above the Bank of England's pain threshold of 4.5 percent with earnings up even when bonuses are excluded. The rise in earnings growth was driven by an increase in public sector pay.
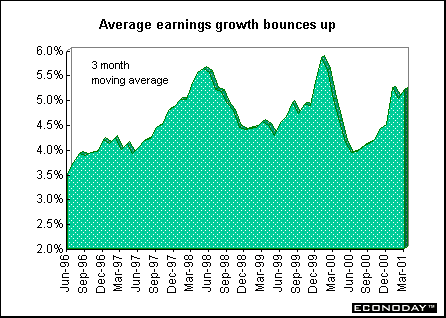
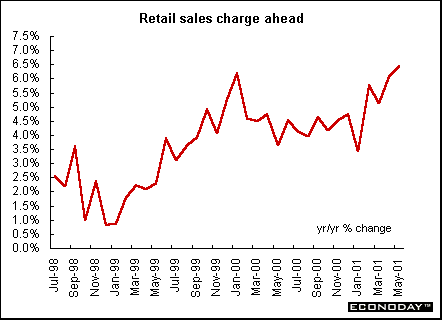
May seasonally adjusted retail sales volumes soared 0.8 percent and 6.4 percent when compared with last year and the highest annual rate since July 1997. Growth was driven by a large rise in food sales, up 1 percent and 4.2 percent on the year. The value of food sales rose 9.2 percent on the year to May, the highest since January 1992. Sales in predominantly non-food stores also rose sharply with volumes up 0.8 percent on the month and 8.9 percent on the year.
Asia
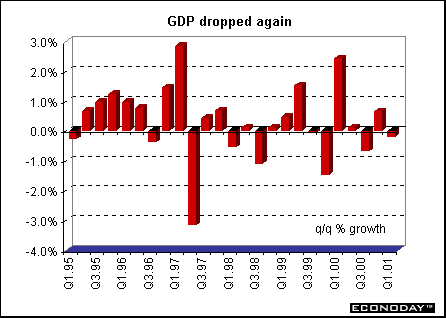
Japan - First quarter seasonally adjusted gross domestic product fell 0.2 percent. Business investment, the biggest source of economic growth over the past two years, fell 1 percent from the fourth quarter, when it increased 6.7 percent. Consumer spending, which makes up about 55 percent of GDP, was unchanged from the fourth quarter. Net exports - imports subtracted from exports - reduced growth by 0.2 percentage points when compared to the fourth quarter. Exports shrank 3.6 percent, the first decline in two years, while imports fell 2.2 percent. Housing investment fell 5.2 percent in the first quarter and government spending was unchanged. The economy grew 0.9 percent in the fiscal year ended March 31, missing the government's 1.2 percent target.
April industrial production fell 2 percent. The operating ratio, a measure of how much factory capacity is being used, fell 1.6 percent. Shipments fell 2.8 percent, more than initial estimates of a 2.5 percent decline. Inventories rose 2.2 percent.
April seasonally adjusted current account surplus widened to 1.03 trillion yen ($8.5 billion), as imports slumped, suggesting companies are buying fewer parts and materials from abroad as they trim production. When compared with last year, the current account surplus fell 24 percent. The year over year decline reflects the continued deceleration of Japan's exports. Imports shot up 13 percent from a year ago. Crude oil prices averaged $25.88 per barrel, down 5 percent from a year ago and the fourth straight month of decline.
Americas
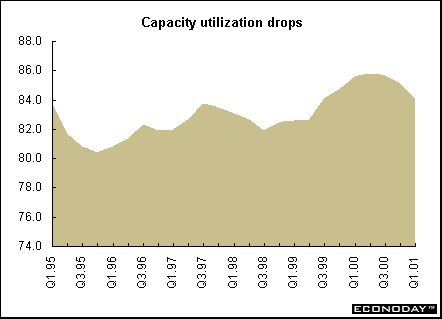
Canada - First quarter capacity utilization slid to 84.1 percent. The rate was down one percentage point from the previous quarter, due in large part to the marked slump in the telecommunications equipment industry. Only mining industries raised their rates, and construction industries held steady. Manufacturers lowered their rate of capacity use for the second quarter in a row, operating at 83.5 percent in the first quarter, down 1.7 percentage points from the fourth quarter of 2000. The decrease was due principally to drops in the electrical and electronics group and the transportation equipment group. Thirteen of the 22 manufacturing groups reduced their rates.
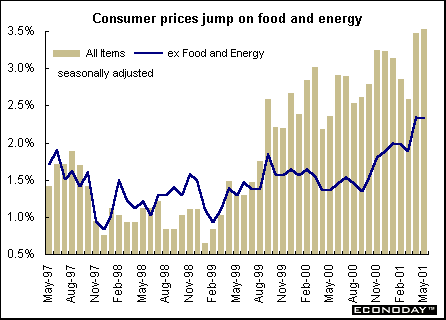
May consumer price index soared 0.9 percent and 3.9 percent when compared with last year. This was the largest monthly increase since January 1991 while the year over year increase was the largest since November 1991. Energy prices were the primary cause of the jump. The food index rose 5.2 percent when compared with last year on higher prices for beef, restaurant meals, fresh fruit and vegetables. Natural gas prices soared 67.4 percent and gasoline prices jumped 12 percent jump when compared with last year. Core inflation - the CPI less food and energy - rose a more sedate 0.4 percent and 2.1 percent when compared with last year. The seasonally adjusted CPI rose 0.5 percent and 3.7 percent when compared with last year. Seasonally adjusted core CPI rose 0.3 percent in May and 2.3 percent when compared with last year. The Bank of Canada's inflation target range is from one to three percent. The Bank has recently constructed a new core inflation measure, which excludes eight volatile components, against which it will judge its inflation target. The Bank's core inflation rate was 2.3 percent when compared with last year.
 |


Introduction • Global Stock Market Indexes • Recap of Global Markets • Currencies • Indicator Scoreboard

The Bottom Line • Looking Ahead
|