
Indicator scoreboard
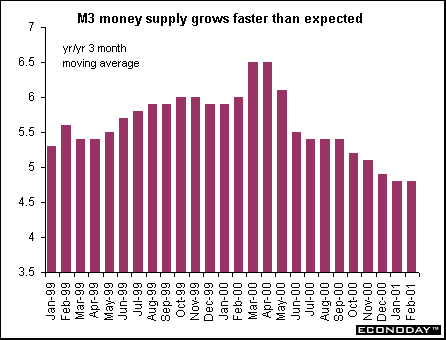
EMU - March M3 money supply growth rose 5 percent when compared with last year. The January to March three month moving average rose 4.8 percent when compared to the same three months a year ago. This is above the ECB's money supply target growth rate of 4.5 percent. A possible revision of the statistical calculation of M3 to exclude holding by non-eurozone residents could result in a significant downward revision of M3 growth, but is not expected to be released until later this year.
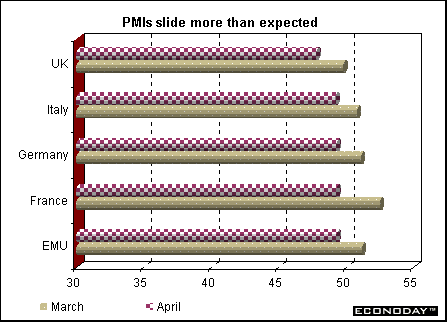
April Reuters' seasonally adjusted purchasing managers index declined to 49.3 from 51.2 in March. It was the 12th consecutive month of decline, hitting its lowest level and showing its first contraction in the manufacturing sector since February 1999. An index level above 50 indicates the manufacturing sector is expanding, while a level below 50 indicates contraction. The prices index, which is not part of the overall PMI, fell to 51.2 in April from 53.5 in March. Among components of the manufacturing activity PMI, the output fell to 50.5 in April from 52.5 in March. The new orders index also fell, declining to 47.8 from 50.9 in March. The EMU PMI is based on results from Germany, France, Italy, Spain, Ireland, Austria and Greece.
April Reuters services activity index fell to 53.0, its lowest level since January 1999. After its peak of 62.2 in April of last year, the index has fallen in each of the following 12 months. Though still signaling expansion, the data reinforce the perception that the pace of economic growth in the EMU is slowing. All of the subindexes of the main activity index fell in April.
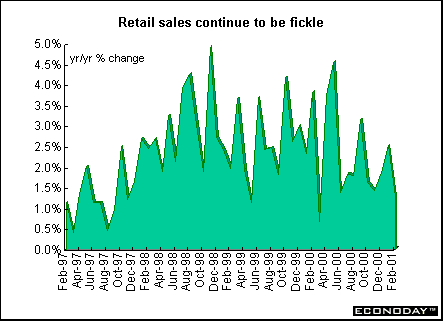
February real inflation, workday and seasonally adjusted retail sales crept up 0.1 percent and 1.2 percent when compared with last year. Many analysts are reluctant to forecast EMU retail sales, given the high volatility in the series and the differing methodologies used in various member countries to calculate retail sales.
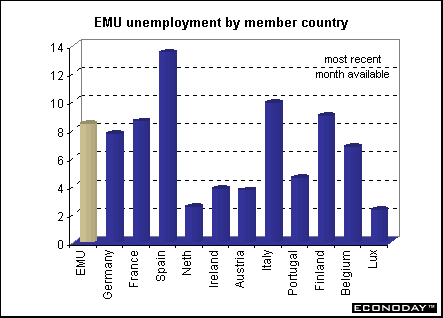
March seasonally adjusted unemployment rate fell to 8.4 percent from 8.5 percent in February, which was revised down from 8.7 percent. The drop brings the jobless rate for the current 12 members to its lowest level since July 1991. Unemployment in Spain and Finland declined while Portugal rose and other countries saw no change.
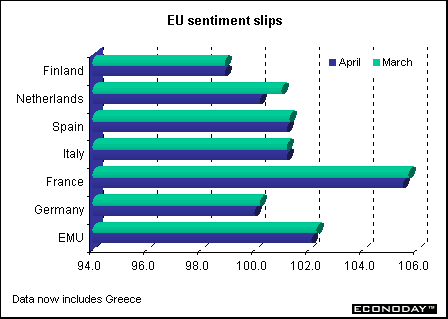
April European Commission's economic sentiment index for the 12 EMU states fell to 102.1 from 102.3 in March. This was the fourth month in a row that sentiment has declined. The data show that while the EMU industrial sector is now in real pain and clearly affected by the U.S. slowdown, other sectors are still surprisingly strong. The latest drop in the overall sentiment index was entirely due to weaker industry confidence. The construction confidence and the consumer confidence index remained unchanged, whereas the share price index increased from March readings. Industrial confidence and consumer confidence each account for one-third of the weighting in the total economic sentiment index. Share prices and construction industry sentiment each count for one-sixth.
Italy - March producer prices edged down 0.1 percent on the month while rising 4.1 percent year-on-year due to lower oil, food and paper prices. Net of energy products, which includes water and electricity as well as oil, natural gas and other fuels, producer prices were unchanged on the month and up 2.2 percent on the year.
February unadjusted industrial orders rose 1.4 percent when compared with last year. Domestic orders fell 2.2 percent while foreign orders jumped 7.4 percent. Domestic orders account for around 62 percent of the overall index. Recently introduced seasonally adjusted month to month orders data, which are not closely followed by most analysts, rose 4.5 percent from January. Domestic orders climbed 4.9 percent, while orders from abroad were up 4.2 percent.
Britain - April Nationwide seasonally adjusted average house price survey rose 0.8 percent. Annual house price inflation moderated to 6.6 percent in April compared with 17.5 percent in April last year.
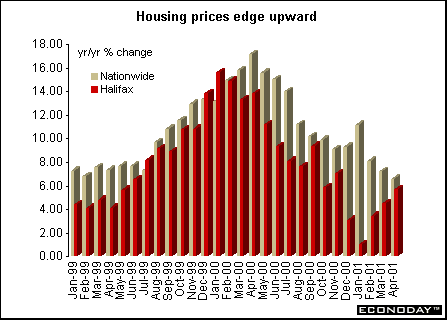
Halifax house price index jumped 1.7 percent and 5.7 percent when compared with last year. The April increase was the fourth monthly increase in succession. Aided by a decline in mortgage rates, the rise signals recent strengthening in housing demand.
April Chartered Institute of Purchase and Supply (CIPS) purchasing managers survey fell to 47.8 from 49.8 in March. This was the worst figure since February 1999's 46.7. Output and new orders also fell to their lowest levels since February 1999. The output index fell to 47.9 in April from 49.6 in March, while the new orders index fell to 48.8 from 50.4.
April seasonally adjusted Chartered Institute of Purchasing and Supply service sector activity fell to 51.2 from 55.7 in March, the lowest level since February 1999 as the impact of the foot and mouth livestock disease showed up in the data for the first time and the U.S. slowdown hit workloads. The survey showed that around one-fifth of all firms reported that activity was down on the month. Business expectations were still high, with the index posting 71.2 in April compared with 75.6 in March, although it was the lowest level seen since December 1998.
Asia
Japan - March workers' real wages rose 0.1 percent when compared with a year earlier, thanks to special bonus payments, though cutbacks in production suggest companies will trim payrolls. Real wages dropped a revised 0.5 percent in February. In the first quarter, wages fell 0.7 percent, which was the first drop in five quarters. Total cash wages fell 0.3 percent in March from a year earlier. Of that, scheduled earnings fell 0.6 percent. Overtime payments fell 1.3 percent from a year earlier, which was the first decline in nearly two years. In the January to March quarter, scheduled wage earnings fell 0.5 percent from a year earlier, as hours worked sank 1.4 percent. Both declined for the first time in five quarters. Overtime hours rose 1.2 percent, the smallest gain in seven quarters.
April small business confidence index fell to 43.5 from 44.6 in March, the seventh straight month that the index has declined. The index is an important gauge of activity because small businesses are sensitive to changes in the economy and employ about 4 of every 5 Japanese workers. Business confidence at small manufacturers declined to 41.4 in April from 44.3 in March, while the index for non-manufacturers rose to 45.1 last month from 44.8 March.
Americas
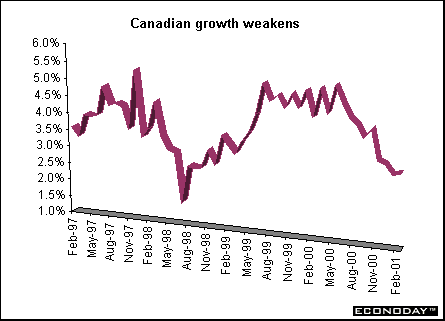
Canada - February real gross domestic product at factor cost fell 0.1 percent, following January's 0.3 percent gain. When compared with last year, it was up 3.1 percent. The decline was led by a sharp drop of 23.1 percent in production of telecommunication equipment. Total manufacturing output fell 0.9 percent but was up 1 percent on the year. The biggest decline was in electrical and electronic products, down 9.1 percent, the largest fall since GDP for this industry was first compiled in 1961. Production of automotive products fell again, though the decline was the smallest since major producers began scaling back operations in the second half of 2000. Excluding electrical and electronic products manufacturing, output in the rest of manufacturing increased 0.3 percent.
March industrial product price index (IPPI) rose 0.5 percent and 2.4 percent when compared with last year. Prices for motor vehicles, paper and paper products provided most of the upward price pressure, more than offsetting declines for petroleum and coal products. Excluding petroleum and coal products, the IPPI rose 2.6 percent on the year. If the effect of the exchange rate were removed, the IPPI would have remained unchanged between February and March rather than increasing 0.5 percent. The impact of the exchange rate was even more apparent on a 12-month basis. The IPPI rose 2.4 percent between March 2000 and March 2001, but without the exchange rate effect rate the rise would have been only 0.7 percent.
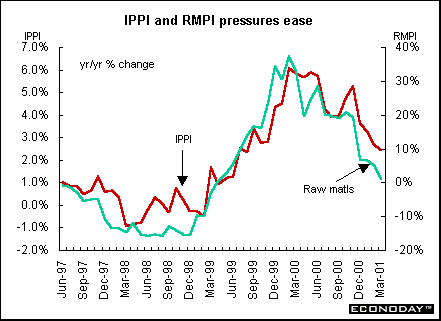
March Raw Materials Price Index (RMPI) dropped 2.1 percent but climbed 1.2 percent when compared with last year. If mineral fuels were excluded, the year-over-year RMPI would have advanced 3.5 percent rather than 1.1 percent. Metal prices also pushed down the RMPI. The decline was more than offset by higher animal and vegetable product prices.


Introduction • Global Stock Market Indexes • Recap of Global Markets • Currencies • Indicator Scoreboard

The Bottom Line • Looking Ahead
|