
Indicator scoreboard
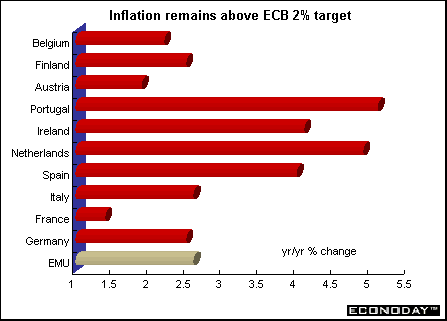
EMU - March harmonized index of consumer prices (HICP) rose 0.4 percent and 2.6 percent when compared with last year. Core HICP, which excludes energy and food, alcohol, and tobacco rose 0.4 percent and 1.8 percent when compared to last year. HICP excluding just energy prices rose 0.4 percent on the month and 2.3 percent in March on the year. The ECB uses the HICP as one of its measures of inflation for policy purposes. The ECB has an inflation target of 2 percent.
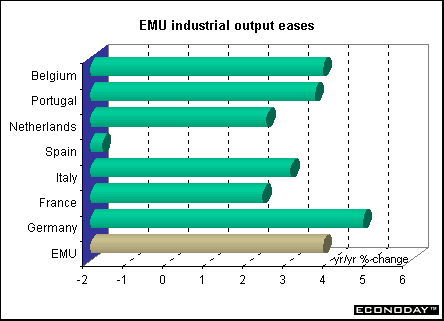
February seasonally adjusted industrial production rose 0.3 percent while work-day adjusted output was up 3.5 percent on the year. EMU output rose in all sectors. Durable goods were up 0.5 percent, non-durable goods were up 0.6 percent, and intermediate goods were up 1.0 percent. When compared with a year earlier, durable capital goods rose 8.0 percent, durable consumer goods rose 2.4 percent, intermediate goods rose 3.5 percent and non-durable goods by 2.4 percent.
Germany - March wholesale prices jumped 0.4 percent and 3.3 percent when compared with last year. A sharp rise in agriculture prices related to mad cow and foot and mouth diseases offset a decline in energy prices. The WPI excluding petroleum products rose 0.9 percent and 3.4 percent when compared with last year.
France - February seasonally and workday adjusted manufacturing output rose 0.3 percent thanks to higher consumer goods and car production. When compared with last year, manufacturing output rose 3.1 percent. Consumer goods output rose 1.0 percent and auto output surged 3.3 percent, Semi-finished and capital goods fell 0.5 percent and 0.3 percent, respectively. Overall industry output excluding construction rose by only 0.1 percent and 2.4 percent when compared with last year.
Italy - March harmonized index of consumer prices rose 0.3 percent and 2.6 percent when compared with last year. The rise in the domestic index for all households (NIC) was confirmed at 0.1 percent on the month and 2.8 percent when compared with last year.
Spain - February unadjusted retail sales plummeted 17.04 percent but were up 4.69 percent from February 2000 levels. Food sales fell 4.86 percent but rose 4.59 percent when compared with last year. Non-food sales plunged 24.06 percent but were up 5.0 percent from the year-ago.
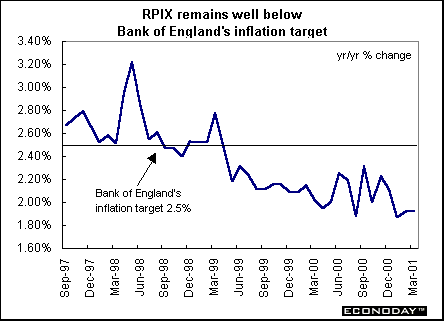
Britain - March retail price index rose 0.1 percent and 2.3 percent when compared with last year. The retail price index excluding mortgage interest payments rose 0.4 percent and 1.9 percent on the year. The Bank of England uses the RPIX as its policy making price inflation indicator. The RPIY, which excludes both mortgage interest payments and indirect taxes, increased by 0.6 percent on the month and 1.8 percent when compared with last year. Not surprisingly, the biggest upward effect came from higher prices for seasonal and non-seasonal food.
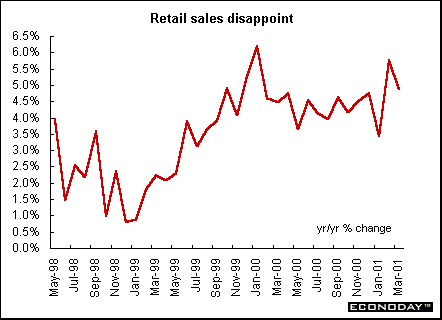
March seasonally adjusted retail sales volumes were unchanged but rose 4.8 percent when compared with last year. Despite the slowdown, retail sales rose 1.5 percent in the first quarter and were up 4.7 percent on a year earlier. While volume growth slowed, the value of spending growth remained strong as prices rose.
Asia
Japan - March department store sales in Tokyo fell 0.6 percent when compared with last year. This was the third straight month of decline as people spent less on clothing and furniture according to the Japan Department Store Association. Sales of clothing fell 1.2 percent, while furniture and other household goods fell 6.2 percent, the association said.
February seasonally adjusted factory usage rose 1.8 percent but fell 4.2 percent when compared with last year for the 25th straight decline. The operating ratio measures how much factory capacity is being used. However, the gain may be temporary, because a decline in exports is forcing companies to slow production and leave equipment idle, which will also curtail investment.
March seasonally adjusted merchandise trade surplus narrowed to 799.5 billion yen ($6.5 billion) from 839.6 billion yen in February. Exports by volume fell 3.1 percent when compared with last year. By value, March exports rose 2.4 percent and imports gained 4 percent. From a year ago, exports increased by 4.7 percent and imports rose 11.4 percent. The trade surplus shrank 40 percent in the three months ended March 31 from a year earlier, the biggest drop in almost five years. Exports rose 3.2 percent last quarter from a year ago, the smallest increase since the fourth quarter of 1999.
Americas
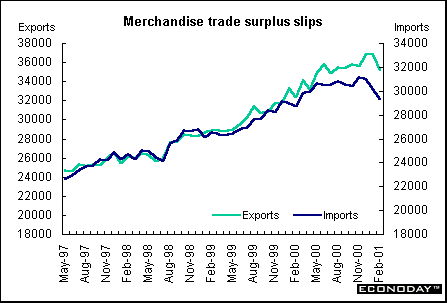
Canada - February merchandise trade fell surplus fell to C$5.87 billion, down from a C$6.67 billion surplus in January. There was a 4.5 percent decline in exports and a 2.8 percent decline in imports. Exports were C$35.1 billion, a decline for the second consecutive month. Exports fell in most commodity groups, especially energy products and machinery and equipment. Lower exports to the United States accounted for two-thirds of the decline. Exports of energy products declined 6.7 percent. However, energy exports were still 57.2 percent higher than in February 2000. Continued high demand for electricity in California extended the rise in electricity exports for the fourth consecutive month. Imports declined 2.8 percent even though automotive parts imports rose 6.1 percent, halting five consecutive months of declines. The trade surplus with the United States fell to C$9.1 billion in February from C$10.16 billion in January. Canada's deficit with all other countries was C$1.16 billion, down slightly from the previous month.
February manufacturers' shipments fell 3.6 percent, the third decrease in four months. Led by substantial decreases in computer and electronic products, motor vehicles and petroleum and coal products, manufacturing shipments were at their lowest level in 14 months. February's declines were widespread with 17 of 21 industries representing 80.1 percent of total manufacturing reporting lower shipments. Unfilled orders rose 4.1 percent. The increase was largely concentrated in the aerospace products and parts industry and, to a lesser extent, the machine industry. Excluding the aerospace products and parts industry, unfilled orders increased a more modest 0.6 percent. New orders increased 5.6 percent due to the significant resurgence of orders in the aerospace product and parts industry. Excluding this industry, new orders declined by 1.1 percent, the fourth monthly decrease in a row. Manufacturers' inventories rose 0.8 percent with the increase distributed between the goods in process sector (up 1.7 percent) and finished products (up 1.2 percent). The inventory to shipment ratio jumped to 1.51, its highest level since May 1992. The trend in the inventory-to-shipment ratio continues to edge up, as it has done since the fall of 1999.
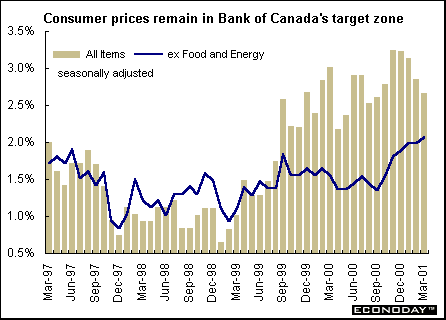
March consumer price index was up 0.3 percent with half of the advance due to increases in prices for food and energy. When compared with a year earlier, the CPI was up 2.5 percent. The CPI excluding food and energy was up 0.1 percent and 1.7 percent when compared with last year. The Bank of Canada has an inflation control target range of from one to three percent. The Bank bases its policy actions on a core measure of the CPI excluding food, energy, and the effects of indirect taxes. On a seasonally adjusted basis, the CPI rose 0.26 percent and 2.66 percent when compared with last year.


Introduction • Global Stock Market Indexes • Recap of Global Markets • Currencies • Indicator Scoreboard

The Bottom Line • Looking Ahead
|