
Indicator scoreboard
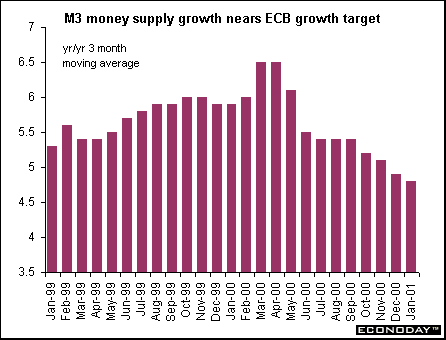
EMU - February M3 money supply growth rate was steady at 4.7 percent rate and remained above the European Central Bank's 4.5 percent reference value. The key three month average of annual M3 money supply growth rates slowed to 4.8 percent for the December to February period from 4.9 percent for November to January (revised down from 5.0 percent). It also remained above the ECB's reference value. Seasonally adjusted M3 growth rose 0.7 percent. However, the pick-up in the adjusted rate may also be at least partly explained by poor seasonal adjustments, so that additional data will be necessary for a reliable interpretation. Private sector credit growth fell to 9.6 percent from 10.0 percent in January and 10.2 percent in December.
January current account deficit was E8.5 billion, less than the E10.4 billion deficit in December. The improvement in the current account balance was caused mainly by a turnaround in the current transfers balance and a reduction in the goods trade deficit. In contrast, the services balance fell further into deficit, while net income outflows rose compared to January 2000.
Germany - February import prices jumped 0.6 percent and 5.4 percent when compared with last year. The February increase came largely from higher crude oil prices, up 4.9 percent, oil products, up 5.3 percent, and higher pork prices up 11.2 percent. Soaring pork prices are due to the impact of BSE and foot and mouth disease. Import prices excluding oil and oil products rose only 0.2 percent and 5.3 percent when compared with last year. Seasonally adjusted import prices fell 0.9 percent but rose 6.4 percent when compared with last year. Seasonally adjusted export prices were unchanged but rose 2.5 percent when compared with last year.
February producer prices rose 0.3 percent and 4.7 percent when compared with last year. The February increase was mainly caused by higher energy prices, up 0.9 percent and 15.8 percent when compared to last year. Excluding energy, the PPI rose only 0.1 percent and 4.6 percent when compared with last year.
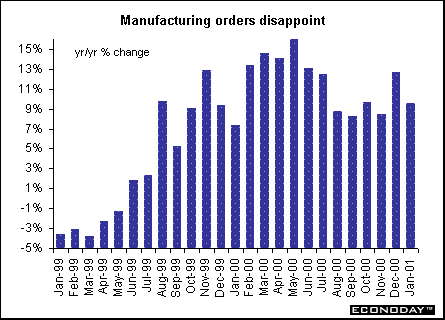
January manufacturing orders were revised to a decline of 3.0 percent from an originally reported drop of 3.9 percent. Orders in west Germany dropped 3.5 percent, while in the east they fell 5.8 percent. Domestic orders fell 0.5 percent and foreign orders dropped 6.1 percent. As January data were revised up and December data revised down, the overall picture for German manufacturing orders does not change much. But it is important to note that the slowdown in January, compared to December, was less severe than first believed.
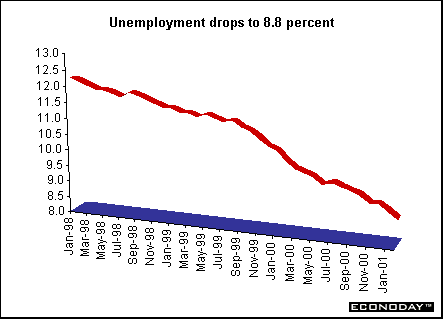
France - February seasonally adjusted unemployment rate fell to 8.8 percent from 9.0 percent in January, according to the International Labor Organization definition, which excludes job seekers who did any work during the month. When compared to February 2000, when the ILO rate stood at 10.2 percent, unemployment was down 347,000 or 13.0 percent.
February producer price index rose 0.2 percent and 3.4 percent when compared with last year because of higher food and consumer goods prices. Excluding food and energy, the PPI rose 0.1 percent and 2.6 percent on the year. Industry energy prices rose 0.2 percent in February for a 6.1 percent increase on the year. Food and agriculture prices were up 0.4 percent on the month and 4.8 percent higher on the year.
Italy - January seasonally adjusted unemployment rate fell to 9.9 percent. The employment surveys are carried out every three months (referring to January, April, July and October). The decline in the unemployment rate was due to a general employment increase in all sectors and particularly in the center and in the south of Italy.
February non-EU merchandise trade surplus was roughly unchanged at 327 billion lire when compared with last year. Both imports and exports posted small increases when compared with recent months, due mainly to technical reasons. Non-EU imports were up 8.0 percent when compared with last year, well below a rise of 31.5 percent the previous month, while exports were up 7.5 percent after a 29.5 percent increase in January. The January merchandise trade deficit with EU trading partners was 208 billion lire. EU exports rose 31.8 percent from January 2000 and imports were up 25.2 percent.
January nominal unadjusted retail sales rose 2 percent and 3 percent when compared with last year. Both food and non-food sales both posted significant increases while small retail outlets also rose; no sector posted a decline.
February producer price index February rose 0.1 percent and 4.9 percent when compared with last year. Excluding energy and utilities costs producer prices rose 0.1 percent on the month and 2.4 percent on the year.
Britain - Fourth quarter current account deficit narrowed to Stg3.696 billion from the third quarter deficit of Stg4.046 billion. This was the ninth consecutive quarter that a deficit has been recorded. The narrowing of the current account deficit was mainly due to higher surpluses on trade in services and investment income, which were partly offset by higher deficits on trade in goods and current transfers.
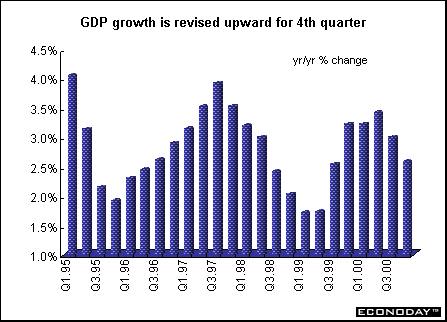
Fourth quarter gross domestic product growth was revised upward to 0.4 percent from the previously estimated 0.3 percent. When compared with last year, fourth quarter growth was revised up to 2.6 percent from 2.5 percent. Construction output was revised sharply higher to show a quarterly rise of 0.9 percent instead of an originally estimated fall of 0.1 percent. Manufacturing output was revised up slightly to 0.6 percent on the quarter from an earlier estimated 0.5 percent. Output of the production industries was left unrevised at a decline of 0.6 percent on the quarter. Household spending was revised down slightly to show a rise of 0.6 percent on the quarter from 0.7 percent, leaving spending 3.4 percent above levels in the year earlier period. Service sector growth was unrevised to show a quarterly increase of 0.7 percent, with output 3.3 percent above a year earlier.
Asia
Japan - February sales at department stores fell 2.5 percent from a year ago, the fifth straight decline, according to the Japan Department Store Association. Supermarket sales slid 6.2 percent according Japan Chain Store Association figures, the 27th straight monthly decline. Retailers such as Takashimaya Co., Japan's biggest department store, and Mycal Corp. the fourth biggest, are hurting as newcomers such as Fast Retailing Co. and Costco Wholesale Corp. are winning customers by cutting prices.
February department store and supermarket sales were unchanged last month after rising 5.6 percent in January, according to the Ministry of Economy, Trade and Industry. At stores open at least a year, sales fell 5 percent from a year earlier - the 34th straight decline. February retail sales fell 0.6 percent from a year earlier after rising 1.2 percent in January to break a record 45-month slump. Overall retail sales were weighed down by severe price competition in the drugstore and clothing-retail industries.
February seasonally adjusted industrial production rose 0.4 percent after plunging 4.2 percent in January. From a year ago, output fell 2.1 percent, the first drop in 21 months. Last month's rise in production was led by 7.3 percent growth in transport machinery as auto makers built more passenger cars. That was largely offset by a 4 percent decline in the electrical machinery industry on waning demand for personal computers and information technology-related products.
March seasonally adjusted Tokyo consumer price index fell 0.5 percent and 0.9 percent when compared with last year. Excluding fresh food, the CPI dropped 0.1 percent and 1.1 percent from a year earlier. February seasonally adjusted nationwide CPI rose 0.1 percent but dropped 0.6 percent when compared with last year for the 17th straight decrease. The CPI survey doesn't include one person households, which make up about a quarter of all households and is on the rise. Also, the popularity of personal computers and mobile phones hasn't been captured since the components of the survey are revised once every five years.
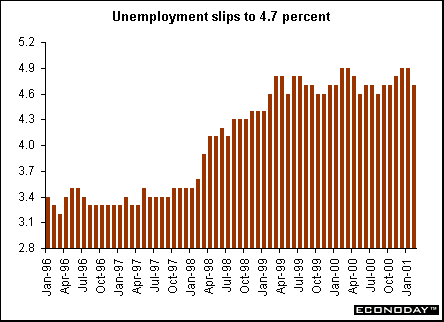
February unemployment rate fell to 4.7 percent from January's record 4.9 percent as more people found employment in the manufacturing and service industries. The total number of employed rose by 410,000 to 63.52 million in February from the same month last year, while the number of unemployed fell for the first time since August, dropping 90,000 from a year earlier to 3.18 million. Despite the decline in the jobless rate, the unemployment rate could rise in the next couple of months as new graduates enter the work force. Employment in service industries increased by 1.2 million jobs or 6.1 percent, while the manufacturing sector added 40,000 jobs during the month to 13.04 million, up 0.3 percent. That offset declines in the construction and retail industries.
February spending by households headed by a salaried worker rose 3.1 percent. When compared with a year ago, spending rose 0.9 percent. The propensity to spend ratio, which rises when people spend more and save less, climbed to 74.4 percent last month from 71.7 percent in January. The Bank of Japan estimates households have savings of upwards of 1,380 trillion yen ($11.1 trillion).
Americas
Canada - February seasonally adjusted industrial product price index rose 0.5 percent and 2.6 percent when compared with last year. This marks the third consecutive month of decelerating growth for the IPPI. Stabilizing petroleum and coal product prices were partly responsible for this reduced momentum. For the first time in over a year, petroleum and coal product prices were not a predominant force behind the annual increase. If the impact of petroleum and coal product prices were excluded, the IPPI would have increased 2.0 percent. Petroleum and coal product prices were up 11.1 percent from February 2000, their smallest annual increase since May 1999.
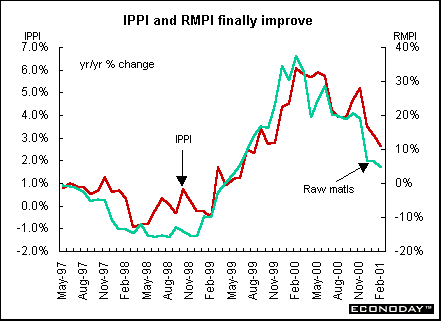
February raw materials price index rose 1.5 percent and 4.7 percent when compared with last year. This marks the fourth consecutive month of decelerating growth for the RMPI. In contrast to the IPPI, mineral fuel prices were responsible for most of the upward price pressure in the annual raw materials price index, accompanied by more modest animal and vegetable product price increases. If mineral fuels were excluded, the RMPI would have advanced 1.6 percent instead of 4.7 percent compared with February 2000.
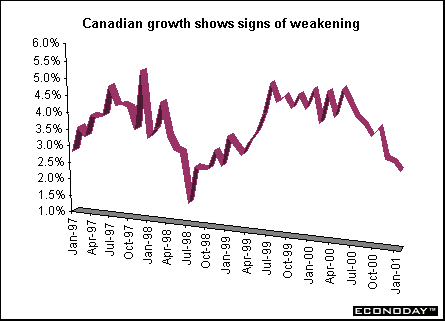
January gross domestic product at factor cost rose 0.3 percent as strength in wholesale and retail trade, construction and oil was partly offset by continued weakness in manufacturing and lower demand for energy. Further declines were reported for the telecommunications equipment production sector. Fifteen of 22 major manufacturing sectors, accounting for 62.4 percent of total manufacturing output, reported advances. Manufacturing edged down 0.1 percent in January after tumbling 0.7 percent in December, while construction jumped by 1.0 percent, twice the rate reported for December. When compared with last year, GDP at factor cost rose 3.2 percent.


Introduction • Global Stock Market Indexes • Recap of Global Markets • Currencies • Indicator Scoreboard

The Bottom Line • Looking Ahead
|