
Indicator Scoreboard
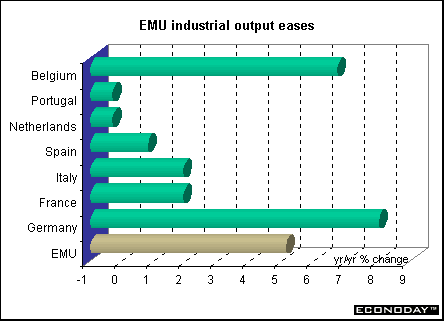
EMU - January seasonally and workday adjusted industrial output fell 1.9 percent but rose 5.1 percent when compared with last year. The data include Greece for the first time. Calendar effects, especially problems concerning the workday adjustment, might have caused part of the deterioration. The data confirm the industrial slowdown in Europe. Output rose only for capital goods, up 0.5 percent on the month. In all other categories, output dropped, led by a 1.4 percent drop in intermediate goods, followed by durable consumer goods (-0.8 percent), and non-durable consumer goods (-0.2 percent).
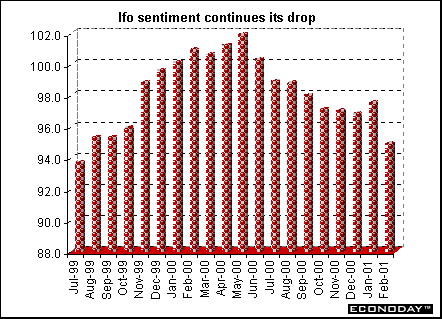
Germany - February Ifo Institute's west German business sentiment index fell to 94.9 from 97.5, more than wiping out January's surprise increase and bringing business confidence to its lowest level in 20 months (July 1999). The February decline is the eighth in the last nine months and raises serious questions about the course of German economic growth this year. Both Ifo current conditions and expectations subindexes declined.
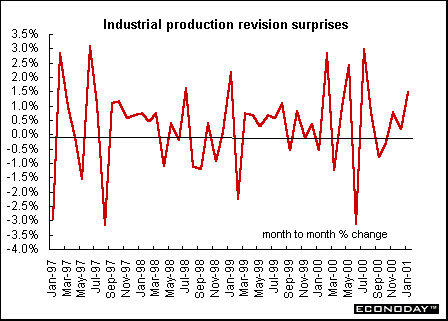
January seasonally adjusted pan-German industrial production was revised sharply upward to an increase of 1.5 percent from the 0.9 percent originally reported. West Germany's increase was revised up to 1.1 percent from 0.9 percent while east Germany's was revised up from 0.7 percent to 4 percent. Details of the January revision are more promising than the original release. While manufacturing remains the only sector to post an output gain (construction, utilities and mining were all still down after revision), all manufacturing sub-components now show increases, in contrast to the weakness shown in several sub-components in the original release.
France - January seasonally and workday adjusted manufacturing output dropped 0.3 percent erasing the December rise due to a drop in semi-finished goods production. When compared with last year, output rose 3.4 percent. Semi-finished goods output dropped 0.8 percent, all but erasing the December gain after nearly two years of strong growth. Other manufacturing sectors posted moderate monthly.
Fourth quarter monthly nonfarm and non-government sector base salaries rose by an average 0.4 percent in the fourth quarter after 0.7 percent increase in the third, for a gain of 2.0 percent on the year. Hourly base wage growth slowed sharply from 1.1 percent in the third quarter to 0.6 percent in the fourth, of which 0.2 percentage point was due to the shorter workweek. The average hours per week declined by 0.4 percent in the fourth quarter to 36.6 hours, for a drop of 3.7 percent on the year.
February seasonally and workday adjusted consumer spending on manufactured goods fell 0.9 percent. When compared with last year spending rose 1.7 percent. The January spending rebound was revised down sharply to an increase of 2.2 percent from the 3.2 percent gain originally reported with downward corrections in all areas but car sales. Excluding autos, parts and pharmaceuticals, spending on manufacturing goods was down 1.1 percent on the month after a revised 2.0 percent increase in January
Italy - Fourth quarter real and seasonally adjusted gross domestic product rose 0.8 percent and 2.7 percent when compared with last year. Although the data were unrevised from preliminary data, the composition of growth was very different. Exports rose 1.4 percent while domestic demand rose just 0.3 percent and capital investment crept up 0.1 percent.
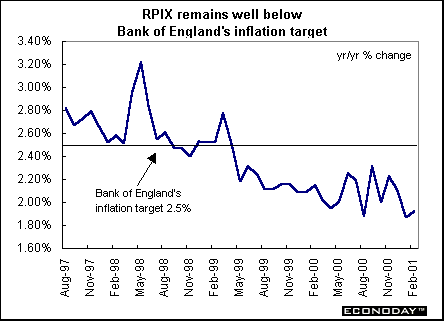
Britain - February retail price index rose 0.5 percent and 2.7 percent when compared with last year. The retail price index excluding mortgage interest payments, which the Bank of England uses as its inflation gauge, rose 0.5 percent and 1.9 percent when compared with last year. The RPIX was pushed higher by the rising costs of gasoline and vehicle insurance. RPIY, which excludes both mortgage interest payments and indirect taxes, rose 0.6 percent on the month and was up 1.6 percent on the year.
February merchandise trade deficit with countries outside the European Union narrowed to Stg2.128 billion from Stg2.449 billion in January. The trade deficit excluding oil and erratics was estimated at Stg1.7 billion compared with Stg2.1 billion in January. The value of exports to non-EU countries in February rose 2.5 percent to while imports dropped 1.4 percent. The January whole world deficit narrowed to Stg2.445 billion from Stg2.901 billion in December. The January trade balance with European Union trading partners recorded a small surplus of Stg4 million versus a deficit of Stg144 million in the previous month.
March Confederation of British Industry (CBI) industrial trends survey showed that the total orders balance dropped to minus 23 percent from minus 16 percent in February for the worst reading since July 1999. Export order books were still well below normal but stabilized, with the balance unchanged at minus 24 percent.
Belgium - The February Belgian National Bank's seasonally adjusted composite industry indicator dropped to its lowest level since July 1999, pointing to a downturn in EMU output in coming months. The BNB's global indicator dropped five points to minus 3.8, pulled down by a "marked fall" in the manufacturing and retail/wholesale sectors. The manufacturing sector indicator, which weighs most in the overall index, plunged 5.3 points after a 0.9 point increase in January, reflecting declines in domestic and foreign orders and expected demand and a rise in finished goods inventories. The Belgian manufacturing sector is widely seen as a leading cyclical indicator for the eurozone, given its concentration on semi-finished goods and the large share of exports to major EMU economies.
Asia
Japan - The January seasonally adjusted tertiary industry activity index, which tracks output at real estate agents, phone companies, insurers and other services, fell 0.5 percent. The decline in January was led by services industries, such as information services and advertising firms, as well as wholesalers, retailers and real estate agents. That was partly offset by increase in transport, telecommunications and power utilities. Economists watch services output because it is closely linked to domestic demand, which accounts for about 60 percent of economic output. Service industries, which rely on domestic demand, are getting less business from manufacturers, who are cutting production amid slowing exports.
The January all industry activity index, which adds construction work, industrial production and government spending to the tertiary index, fell 1.8 percent, the first drop in three months. Much of the decline came as industrial production, which accounts for about one-fifth of overall output and drives demand for services, dropped 4.2 percent in January. The biggest decline in more than six years was caused by reduced demand for Japanese exports from slowing United States and Asian markets. Economists use the all industry index as a proxy for gross domestic product. The index tallies production of goods and services, while GDP tracks spending on goods and services.
Americas
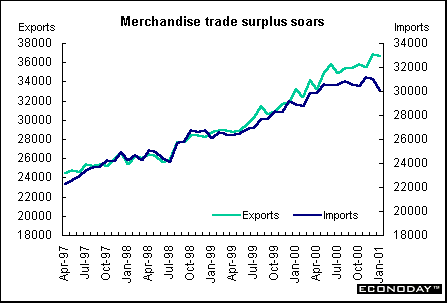
Canada - January seasonally adjusted merchandise trade surplus rose to C$6.57 billion, up from C$5.85 billion in December. Exports declined 0.4 percent despite a post-Christmas resurgence of automotive products and industrial goods and materials exports. The decline was the result of sharp drops in energy products and machinery and equipment exports. At the same time, imports fell at a faster pace, declining 2.9 percent to $30.1 billion, led by the fifth straight monthly decline in motor vehicle part imports, mainly from the United States. The January surplus with the United States rose to C$10.07 billion. All other countries showed a deficit.
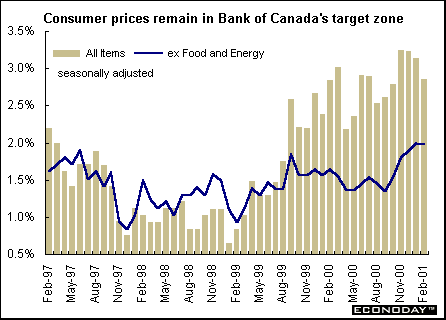
February not seasonally adjusted consumer price index jumped 0.4 percent and 2.9 percent when compared with last year. The CPI rose mainly because of increases in prices for natural gas, travel tours and clothing. The CPI excluding food and energy rose by 0.5 percent after a decrease of 0.2 percent in January and rose 2 percent when compared with last year. The February seasonally adjusted CPI rose 0.4 percent and 2.85 percent when compared with last year. The CPI less food and energy rose 0.27 percent and 1.98 percent when compared with last year.
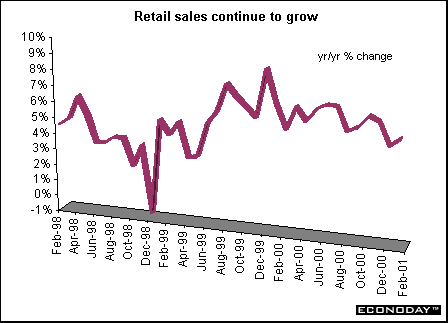
January retail sales climbed 0.6 percent and 5.4 percent when compared with last year. Furniture sector retail sales jumped 6.1 percent while clothing climbed 4.0 percent. All sectors but food stores posted higher sales in January. When excluding motor and recreational vehicle dealers, which account for nearly a quarter of the total, retail sales were unchanged for the month.
January seasonally adjusted manufacturing shipments edged up 0.3 percent. Strong gains in the aerospace product and parts and chemical industries were largely offset by sizeable declines in the computer and electronic product, motor vehicle and motor vehicle parts industries. Excluding the impact of the aerospace product and parts industry, shipments dropped 0.7 percent in January. Shipments increased in 11 of the 21 major groups this month, representing 63.6 percent of total shipments, and five provinces and the territories also reported higher monthly values. Unfilled orders declined 2.3 percent, the lowest level since June 2000 and the fifth decrease in six months. New orders fell 1.3 percent, due to significant decreases in the aerospace product and parts, and computer and electronic product industries. Data collected for the Monthly Survey of Manufacturing (MSM) are now classified according to the 1997 North American Industry Classification System (NAICS), which replaces the 1980 Standard Industrial Classification (SIC). Reference year 2000 is the last year for which data are released on a SIC basis.
 |


Introduction • Global Stock Market Indexes • Recap of Global Markets • Currencies • Indicator Scoreboard

The Bottom Line • Looking Ahead
|