
Indicator scoreboard
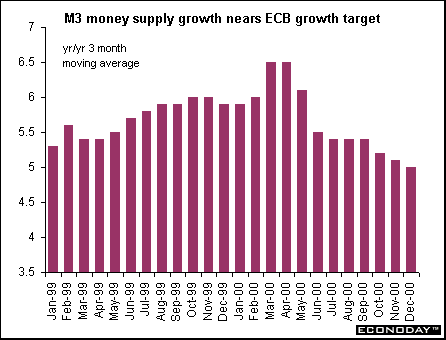
EMU - January M3 money supply rose 4.7 percent when compared with last year. The three month moving average rose 5 percent when compared with the same months last year. This remains above the ECB's target rate of M3 money supply growth of 4.5 percent. January seasonally adjusted increase was 0.2 percent.
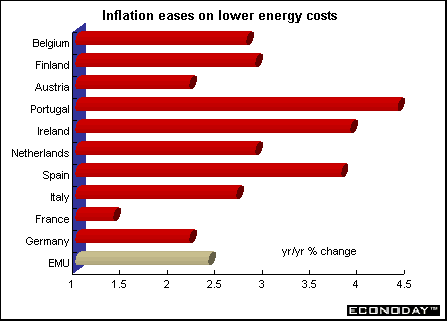
January harmonized index of consumer prices fell 0.1 percent but rose 2.4 percent when compared with last year. Core HICP excluding both food and energy was unchanged on the month, with the annual rate rising to 1.6 percent. But HICP excluding just energy rose 0.2 percent on the month and 1.9 percent when compared with last year. The January data includes Greece for the first time.
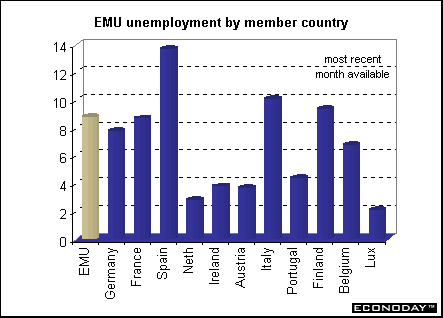
January seasonally adjusted unemployment rate rose to 8.8 percent. While the January data included an estimate for Greece, the December data did not. Of the eight EMU states reporting data, January unemployment fell in one (France), remained unchanged in four but moved up in three.
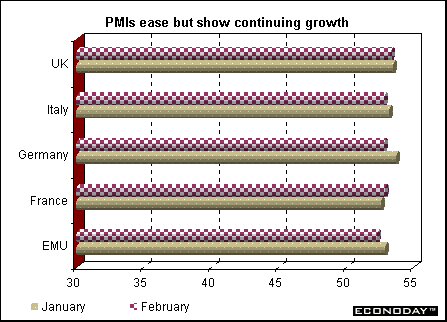
February Reuters seasonally adjusted purchasing managers' index fell to 52.3 from 52.9 in January. This was the 10th month in a row that the index has declined, hitting its lowest level since May 1999. It indicates that the pace of manufacturing sector growth continues to slow. An index level above 50 indicates the manufacturing sector is expanding, while a level below 50 indicates contraction. The prices index, which is not part of the overall PMI, fell to 55.8 in February from 59.0 in January. The EMU PMI is based on results from Germany, France, Italy, Spain, Ireland, Austria and Greece.
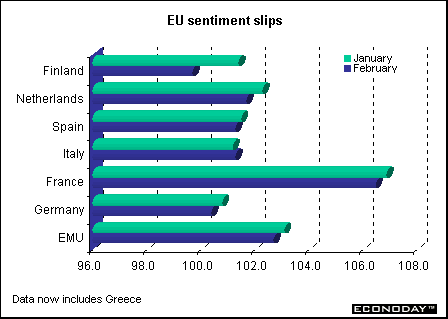
February European Commission's economic sentiment index fell to 102.7, the lowest level since October 1999, as all components of the index dropped. Industrial sentiment showed the largest drop, to plus 1 in February from plus 3 in January and plus 5 in December. Manufacturing production expectations fell to plus 12 in February from plus 14 in January and plus 18 in December. Consumer confidence slid slightly to minus 2 from minus 1 in January.
Germany - January seasonally adjusted import prices fell 0.9 percent but were 6.4 percent above the year earlier level. Non-seasonally adjusted import prices fell 0.8 percent on the month and rose 6.5 percent on the year. Seasonally adjusted export prices fell 0.3 percent in January but rose 2.8 percent on the year.
Fourth quarter gross domestic product rose 0.2 percent and 1.9 percent when compared with last year. This is the slowest pace since the second quarter of 1999. Third quarter growth was revised down to 0.3 percent and 2.8 percent when compared with last year. The sole contributors to fourth quarter growth were inventory accumulation and government. Private consumption and investment contributed nothing to fourth quarter growth, and net exports subtracted 0.3 percentage point. On a seasonally adjusted basis, fourth quarter GDP rose 0.2 percent and 2.65 percent when compared with last year.
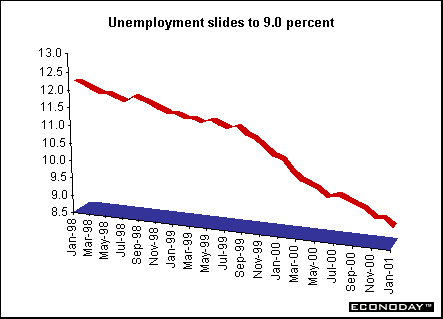
France - January seasonally adjusted number of French unemployed fell by 1.9 percent or 46,000 to 2.355 million in January, cutting the unemployment rate 0.2 point to 9.0 percent, according to the ILO definition which excludes job seekers who did any work during the month. Compared to January 2000, when the ILO rate stood at 10.5 percent, unemployment was down 378,000 or 13.8 percent.
January producer price index declined 0.5 percent put rose 3.6 percent when compared with last year. The monthly decline was because of lower energy prices. Industry energy prices fell 3.9 percent on the month but were up 7.5 percent on the year. Excluding energy and food, the core PPI rose 0.3 percent and 2.6 percent when compared with last year.
Italy - December nominal unadjusted retail sales rose 1.3 percent on the year, the lowest since 1996 when the current index was introduced. Over 2000 as a whole, retail sales rose at an average rate of just 1.4 percent from the previous year, the lowest increase since the index was rebased in 1996.
January non-EU merchandise trade deficit worsened to 2.227 trillion lire compared with a L1.282 trillion deficit in January 2000. Higher oil import prices were the main contributor. Non-EU imports were up 31.5 percent and exports were up 27.6 percent when compared with last year. December trade deficit with EU trading partners was L2.138 trillion compared with a deficit of L1.946 trillion in December 1999. EU exports rose 4.7 percent and imports were up 5.1 percent when compared with last year. December world trade deficit was L367 billion, with imports rising 12.5 percent and exports up 9.2 percent when compared with last year.
December industrial orders rose 9.1 percent when compared with last year. Domestic orders rose 10.6 percent while foreign orders increased by 6.8 percent. Average order growth in 2000 was 11.3 percent over 1999, the biggest increase since the index was created in 1995. December seasonally adjusted data, which was recently introduced and is still not closely followed by most analysts, showed December's orders rose 7.6. Domestic orders climbed 11.8 percent on the month, while orders from abroad were up 1.8 percent.
January producer prices were unchanged from December as falling energy prices held down the index. When compared with last year, the PPI rose 5.4 percent, down from the 6.2 percent rate in December.
Britain - February seasonally adjusted Chartered Institute of Purchasing and Supply purchasing managers index rose slightly for a second month running to 52.1 in February from 52.0 in January. This signals continuing growth for the 23rd month running. The new orders index rose to 54.6 in February from 53.4, the strongest rate of growth since December 1999.
Asia
Japan - January seasonally adjusted industrial production sank 3.9 percent when compared with last year. The monthly drop was its biggest decline in more than six years as assembly lines slowed in response to a slide in export orders. The decline in production was led by Japan's three biggest industries - transport equipment, electrical machinery and general machinery. Total shipments of manufactured goods fell 3.8 percent, the biggest drop since April 1999 but rose 1.7 percent from a year ago. Overall inventories rose 0.6 percent from December and 2 percent from a year earlier, the fourth straight increase. Another alarming sign was that inventories rose 0.6 percent despite the sharp drop in output, indicating companies aren't reducing output fast enough to make up for falling demand. The inventories-to-shipments ratio - a key indicator of supply-demand conditions - shot up 2.6 percent.
January seasonally adjusted sales at large retail stores increased 5.8 percent after falling 4.4 percent in December. At stores open at least one year, sales fell 2.4 percent from a year ago, the 33rd straight decline.
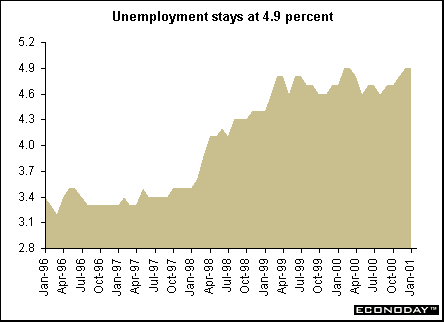
January unemployment rate held at a record 4.9 percent. December's jobless rate was higher than earlier estimated at 4.9 percent revised from 4.8 percent. There were 65 jobs available for every 100 applicants at state run work centers in January, down from 66 in December.
February Tokyo seasonally adjusted consumer prices excluding fresh food fell 0.3 percent, suggesting the nation's two year bout of deflation may be getting worse. When compared with last year, prices plummeted 1.1 percent. January all Japan CPI dropped 0.2 percent and 0.5 percent when compared with last year.
Americas
Canada - January seasonally adjusted industrial producer price index (IPPI) edged down 0.2 percent but rose 3.1 percent when compared with last year. Rising petroleum and coal product prices accounted for more than one-third of the annual increase in January. If the impact of petroleum and coal product prices were excluded, industrial product prices would have increased 1.9 percent instead of 3.1 percent. Prices for paper and paper products and motor vehicles also contributed to the annual rise, while falling prices for lumber had a dampening influence.
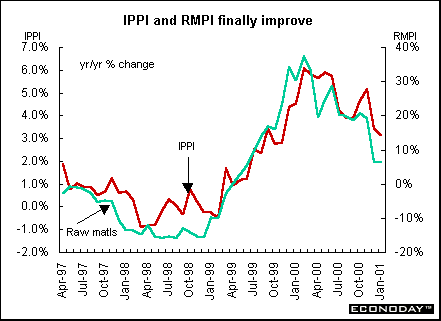
January raw materials price index (RMPI) rose 0.7 percent and 6.4 percent when compared with last year. Mineral fuel prices were at the heart of both the annual and monthly rises in the RMPI. If mineral fuels were excluded, the index would have advanced 1.7 percent instead of 6.4 percent on an annual basis. The monthly index would have been negative (-0.4 percent). Natural gas prices advanced 5.4 percent in January compared with December, leaving prices 52.3 percent higher than in January 2000. Concerns continued over low inventories, as demand continued to outstrip supply.
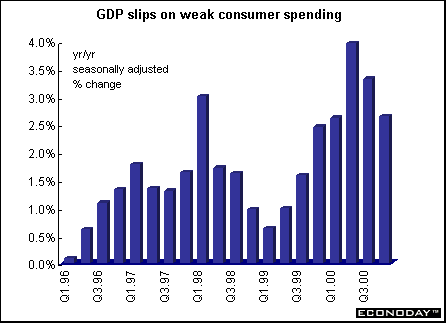
Fourth quarter real gross domestic product climbed 0.6 percent and 4 percent when compared with last year. On an annualized basis, GDP rose 2.6 percent. For the year 2000, GDP rose 4.7 percent. For the fourth quarter, the level of final domestic demand was virtually unchanged following several quarters of solid growth, and export growth slowed further to 0.3 percent. Business plant and equipment investment fell 2.4 percent; an increase in non-residential construction was more than offset by a 4.0 percent drop in machinery and equipment purchases. Virtually every category of machinery and equipment investment registered a decline. Growth in personal spending slowed to 0.6 percent, largely owing to an 8.6 percent drop in motor vehicle purchases after dealer incentives boosted growth in the third. Excluding motor vehicles, the growth of personal expenditure would have been 1.1 percent. The early arrival of winter in many areas of Canada boosted spending on natural gas and electricity, and also encouraged purchases of recreational and sporting equipment.
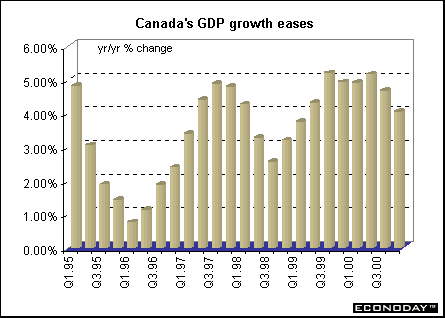
December seasonally adjusted real gross domestic product at factor cost rose 0.2 percent, held back by continued weakness in manufacturing, especially in production of telecommunications equipment and automotive products. Excluding the manufacturing sector, output in the rest of the economy rose 0.4. On an annualized basis, fourth quarter 2000 GDP rose 2.6 percent, versus 4.5 percent in the third quarter. A majority of the major industry groups in manufacturing, 14 of 22 accounting for 65 percent of total manufacturing output, reported declines.
Fourth quarter seasonally adjusted current account surplus rose C$1.2 billion to reach C$5.9 billion. This was the fourth large surplus in a row, and brought the total for 2000 to C$18.9 billion, more than four times the last annual surplus of C$4.6 billion posted in 1996.


Introduction • Global Stock Market Indexes • Recap of Global Markets • Currencies • Indicator Scoreboard

The Bottom Line • Looking Ahead
|