<%@ Language=VBScript %> <% Response.Write(cszCSS) %> Econoday | Resource Center | Fed Watching Indicators

Back to Resource Center
About the FedFed Watching IndicatorsFed StatisticsKey Fed Facts

Fed Watching Indicators
Alternative Inflation Meausures
Gold Prices
Employment Cost Index
Civilian Unemployment Rate
Pool of Available Labor
Non Farm Productivity
Treasury Yields
Stock Prices
Humphrey-Hawkins Actions


Pool of Available Labor
Short Term Perspective
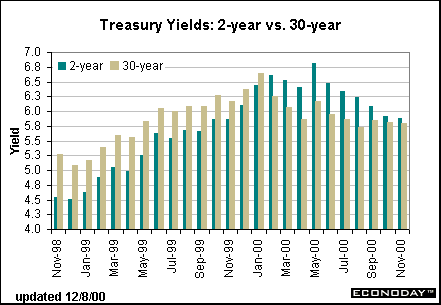
Financial turmoil in Russia led to problems in the hedge fund market and created a flight to quality in the second half of 1998. As a result, Treasury yields fell sharply. It took nearly a year to get yields back to levels we saw in early 1998. Spreads narrowed in late 1999. In February, the yield on the 30-year bond fell below the yield on the 2-year note since the Treasury announced its plan to reduce the supply of 30-year bonds going forward. The yield on the 2-year note decreased for the sixth straight month in November, but the yield on the 30-year bond remained unchanged.

Long Term Perspective
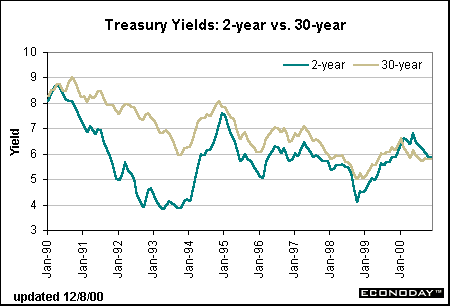
The yield between the 2-year note and the 30-year bond reflects changes in the economic environment. When the spread narrows, it reflects potential softening in economic activity -- possibly even recession. (The 2-year note and 30-year bond yields were equal in 1989 just before the 1990-91 recession.)


Continue


Alternative Inflation Measures   •   Gold Prices   •   Employment Cost Index   •   Civilian Unemployment Rate

Pool of Available Labor   •   Nonfarm Productivity   •   Treasury Yields   •   Stock Prices   •   Humphrey-Hawkins Actions

© Econoday, 2000. All Rights Reserved.

Legal Notices | © 2000 Econoday, Inc. All Rights Reserved.