<%@ Language=VBScript %> <% Response.Write(cszCSS) %> Econoday | Resource Center | Fed Watching Indicators

Back to Resource Center
About the FedFed Watching IndicatorsFed StatisticsKey Fed Facts

Fed Watching Indicators
Alternative Inflation Meausures
Gold Prices
Employment Cost Index
Civilian Unemployment Rate
Pool of Available Labor
Non Farm Productivity
Treasury Yields
Stock Prices
Humphrey-Hawkins Actions


Pool of Available Labor
Short Term Perspective
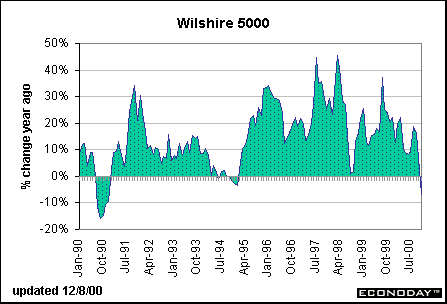
At his Humphrey-Hawkins testimony on February 17, Greenspan noted that stock prices would have to rise at about the same pace as income in order for consumers to moderate their spending behavior. That means stock prices would have to rise about 6 percent a year rather than the long-term average of nearly 11 percent a year. Well, we are a far cry from that point since stock prices declined in November from year ago levels. The wealth effect may be going into reverse.

Long Term Perspective
Fed chairman Alan Greenspan set the financial markets on edge several years ago when he first commented on the stock market by making an observation on the "irrational exuberance" of investors. While Greenspan and friends don't tend to comment directly on valuation of stock prices too often, they constantly are talking about the ubiquitous "wealth effect," which is allegedly causing consumers to spend more than they earn in income. There is no question that Fed governors and district bank presidents monitor stock prices closely. The Wilshire 5000 is a broad market indicator that incorporates both the impact from the old economy (such as the Dow Jones Industrials) and the new economy (such as the NASDAQ composite.)


Continue


Alternative Inflation Measures   •   Gold Prices   •   Employment Cost Index   •   Civilian Unemployment Rate

Pool of Available Labor   •   Nonfarm Productivity   •   Treasury Yields   •   Stock Prices   •   Humphrey-Hawkins Actions

© Econoday, 2000. All Rights Reserved.

Legal Notices | © 2000 Econoday, Inc. All Rights Reserved.