<%@ Language=VBScript %> <% Response.Write(cszCSS) %> Econoday | Resource Center | Stock Prices

Back to Resource Center
Production and SalesInflationFederal Reserve PolicyInterest RatesStock Prices

Stockprices


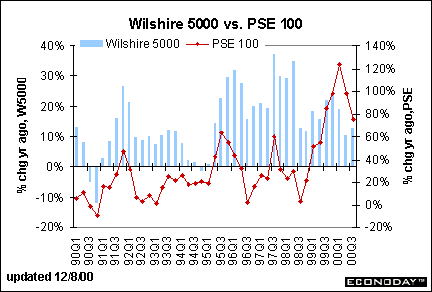
Wilshire 5000 vs. PSE Technology 100

Long Term Perspective


The Wilshire 5000 is the most comprehensive measure of the stock market. Here it is compared with a very narrow measure of fashionable high tech stocks.

Short Term Perspective


Not surprisingly, the high tech stocks are zooming even after their fall. The Wilshire 5000 fell in November relative to year ago levels.
Continue


S&P 500 vs. Russell 2000   •   Dow Jones Industrials vs. Nasdaq Composite

Wilshire 5000 vs. PSE Technology 100   •   Interest Rate Yield vs. Stock Market Growth

© Econoday, 2000. All Rights Reserved.

Legal Notices | © 2000 Econoday, Inc. All Rights Reserved.