 |

Trade deficit widens
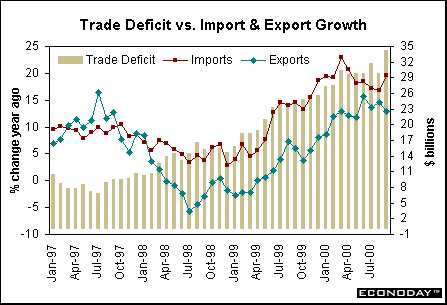
The international trade deficit on goods and services widened sharply in September to $34.3 billion from a $29.8 billion shortfall in August. Exports dipped 0.7 percent and imports jumped 3.1 percent during the month. Among merchandise exports, declines were registered in all but one category (industrial supplies and materials) following strong gains in the previous months (across all merchandise categories). Among merchandise imports, only the small food, feeds & beverages, and "other" merchandise recorded declines in September. In particular, industrial supplies and materials posted a healthy gain (this does incorporate oil products with their attendant higher prices, though). After several months of moderation, imports once again renewed their faster pace of growth. At the same time, exports began a slower growth path after gaining speed the past few months.

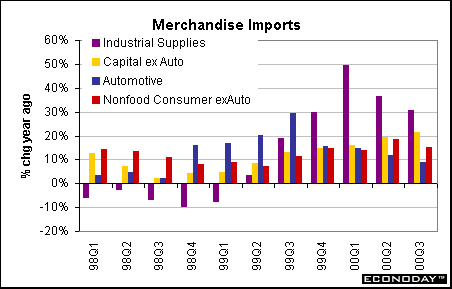
The chart below compares growth in the four major merchandise categories. Notice that yearly gains in imports have been concentrated in industrial supplies over the past five quarters. There is no question that a good chunk of this increase is due to higher oil prices. (The declining trend in industrial supplies in 1998 and early 1999 was due to lower oil prices.) But in a booming economy, industrial supplies and materials often accompany gains for capital equipment. The increases in the yellow and red bars (nonauto capital goods and nonauto consumer goods) appear to be posting shallow gains. But look at the legend: gains are between 10 and 20 percent for much of 1999 and 2000. The good news on the import front is that a good portion of the imports is indeed capital goods. Increased capital spending increases the capacity of U.S. production and reduces the potential for inflationary pressures.

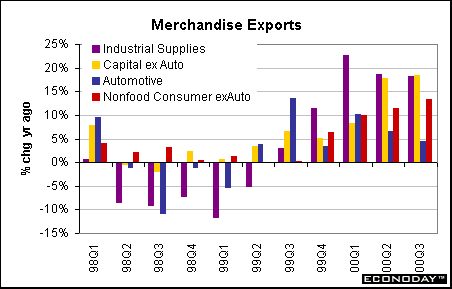
The chart below depicts the various growth rates among merchandise exports. In a similar fashion to imports, industrial supplies and materials of exports increased sharply on a year-over-year basis in the past year due to rising oil prices. Key categories of exports have picked up steam in 2000: nonauto capital goods, nonauto consumer goods as well as automotive vehicles and parts.

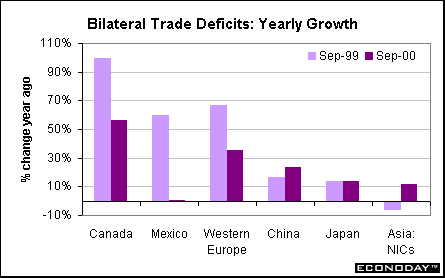
Bilateral trade deficits are not adjusted for seasonal variation. Consequently, one must take the monthly changes with a grain of salt. In the chart below, we compare the year-to-date trade deficits through September. It is interesting to note that the bulk of the movement in the past two years has centered on Canada and Western Europe. Our deficits with Japan and China, two political hotspots, have actually shown only moderate gains. It is well to note, though, that the deficits with these particular countries were high already. Incidentally, China surpassed Japan in September's data with the greater trade deficit.
Given that China and Japan are perennial deficits, it is important for the U.S. to have trade surpluses with other countries - if it wants to narrow the trade deficit. In the past, the U.S. has seen surpluses with Canada and Western Europe. But the strong value of the dollar versus the Canadian dollar and the euro in the past couple of years has led (at least partially) to a burgeoning of bilateral deficits.


Markets at a Glance • Recap of US Markets • The Economy • The Bottom Line • Looking Ahead
© Econoday, 2000. All Rights Reserved.
|
 |