Since holiday sales make up a good portion of retailers' yearly profits, retailers and analysts begin gauging demand as soon as the school year begins. Often, analysts claim that a good selling season at the start of the school year will turn into a good Christmas. Actually, the pattern of sales for the past ten years does not confirm this rule of thumb. Sometimes a good fall season does lead to healthy Christmas sales, and sometimes it doesn't.
Retail sales edged up a measly 0.1 percent in October after a healthy 0.9 percent in September. Fluctuating auto sales boosted September's results and depressed October's. Excluding this volatile sector, retail sales rose a moderate 0.4 percent in October after gaining 0.7 percent in September. If the slower pace of sales were to continue through year end, fourth quarter retail sales may be headed for their slowest growth rate in more than two years.
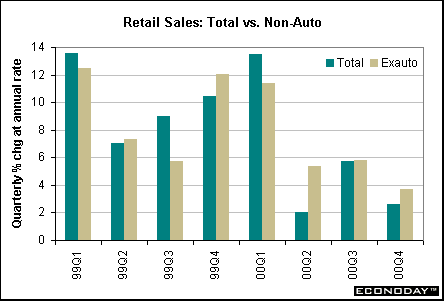
From an economic perspective, Federal Reserve officials would welcome a slower consumer sector as it would improve the chances of a soft landing. (Soft landing = slow economic growth with little or no inflation). Soft economic growth is generally favorable for the bond market because it means lower interest rates. Equity investors have a different perspective. Softer retail sales could mean that retail stock prices may erode or not appreciate as rapidly as they have in the past few years.
This article compares the performance of specific retailers with specific components of the industry, and considers what the results may say about the about the direction of their stock prices.
General Merchandise Sales
Department stores account for roughly 10 percent of retail sales and are the major component of the "general merchandise" category in retail sales. One way to compare retail stocks with each other is to compare them against their group. The charts below compare the year-over-year percent change in general merchandise store sales relative to the year-over-year percent change of a particular company's stock price. Since retail sales are monthly figures, we could look at the monthly average stock price or the stock price at the end of the month. For simplicity, we chose the latter for this exercise.
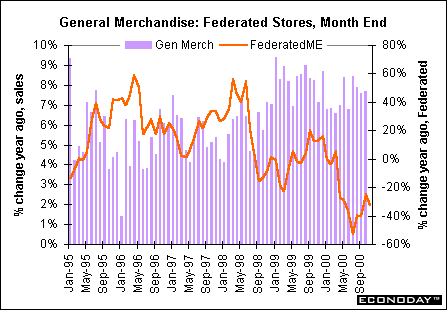
The chart above compares general merchandise store sales to Federated Department stores. Stores within the Federated group are considered upscale compared to other stores we will look at below. However, Federated purchased Fingerhut catalog which offered credit cards to low income/high risk individuals. Credit problems pushed down Federated's stock price even though retail sales were generally strong. Note in the chart below how Kohl's stock price is performing so much better than Federated. Kohl is a mid-level department store but doesn't suffer from any of the credit card problems that Federated has taken on.
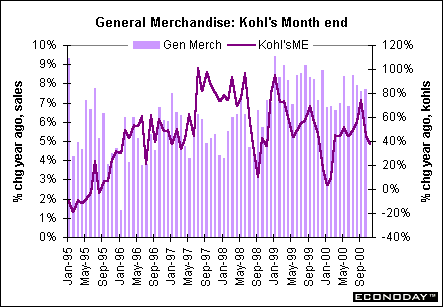
How should one choose between these two companies as potential stocks to own? If you are a contrarian investor, you might pick Federated, figuring that all the bad news is already incorporated into the stock price. On the other hand, you might feel better buying a company that is better managed over the long run and choose Kohl's instead. Remember, though, that in addition to tracking how well the company performs relative to retail sales, you need to track company fundamentals (earnings, P/E ratios, etc.).
Discount stores
The charts below show the stock price of two different discount stores which have somewhat of a different business model. Wal-Mart actually has two components - the regular retailer that is open to all consumers plus Sam's Club where customers must pay an annual fee.
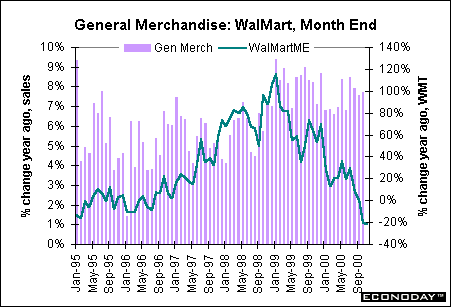
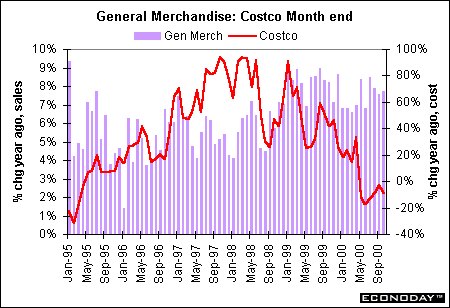
Costco is a low-priced wholesaler where consumers must also be members. The pattern of the company's stock price mirrors that of Wal-Mart for the most part. It seems that neither of these discount stores benefited much from the retail sales spurt of 1999 and 2000, although Costco did gain sharply the prior two years when industry sales growth was a bit softer. Typically, discount stores tend to outperform regular-priced retail stores when economic activity is waning and consumer demand is generally down.
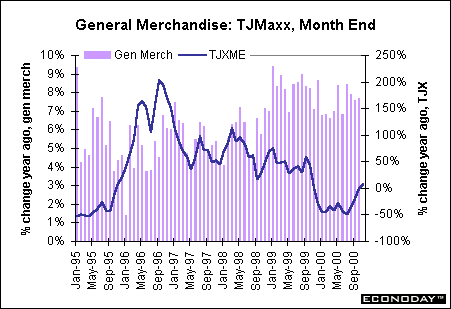
TJ Maxx is a different kind of retailer than Costco and Wal-Mart. While the latter two sell everything from soup to nuts, TJ Maxx is more apparel oriented. Also, it doesn't sell groceries like Costco and Wal-Mart. Actually, the stock price of this retailer appears recently to be outperforming the other two on a year-over-year basis, though a downward trend in the 1999-2000 period hit TJ Maxx as well. This discount store might benefit from an economic downturn as well since more consumers are likely to look for bargains when economic activity is less robust.
Apparel Stores
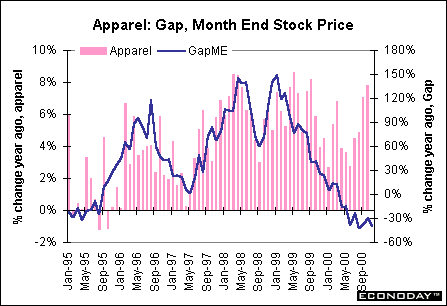
Apparel store sales are only one-third the volume of department store sales. As seen in the chart below, apparel sales tend to be somewhat more volatile from one month to the next. Notice that yearly gains in apparel store sales were not quite as strong as department stores from 1999 through mid-2000. Even as apparel store sales gained moderately during this period, the stock price for The Gap plummeted. The plunge wasn't caused by apparel stocks doing poorly in general, but was specific to the company itself as it under performed its competitors relative to the previous year. The GAP also owns Banana Republic stores and Old Navy stores.
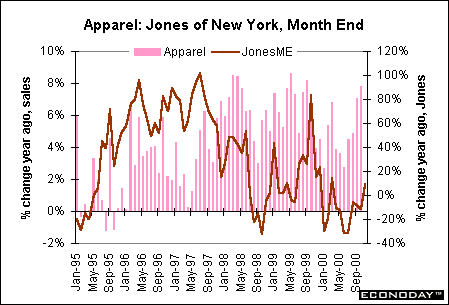
Apparel maker Jones of New York has been more volatile than The GAP but has outperformed it in recent months. Jones of New York appears to have an inverse relationship to store sales. That is, when apparel store sales are accelerating, the stock price is declining or rising more slowly and vice versa.
Durable goods
Most consumers don't find cars under their Christmas trees, but sales can pick up in good economic times around the holiday season. Sales have moderated the past several months, in line with the general slowdown of consumer spending.
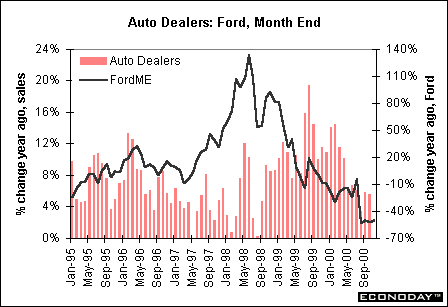
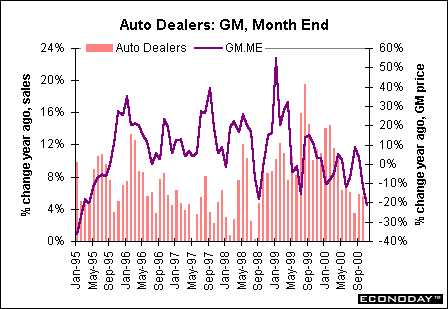
The stock price of General Motors has probably fluctuated somewhat more dramatically in the past few years than that of Ford Motor Company. In recent months, GM seems to be outperforming Ford on a year-over-year basis. Motor vehicle sales have been quite robust in recent years and analysts believe that replacement demand for old cars has been satisfied. At this point, car purchases are discretionary and mostly second or third family vehicles. This means that the first sign of downturn could slow demand dramatically. We may see further deterioration in the stock prices of these automakers. Typically, equity prices are at their lowest during the trough of an economic recession. Then car stocks make good buys.
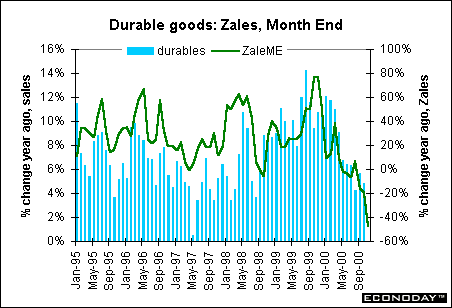
Though cars and trucks may not be considered standard holiday gifts, jewelry certainly is. In the chart below, we compare the year-over-year gain in Zales' stock price to the yearly gain in total durable goods. One could break out auto, furniture and building materials from the durable goods group and be left with "other" durables of which jewelry stores play a good role. As it turns out, the "other" category is too volatile to reflect trends. Therefore, comparing jeweler Zales' (stock price) to total durable goods shows a pretty good correlation.
THE BOTTOM LINE FOR INVESTORS
Given all the hoopla with day trading, one tends to think of following economic indicators only for their macroeconomic consequence. That is, strong retail sales are bearish for the bond market and bullish for the equity group in a short-term trade. Conversely, weak retail sales are bullish for the bond market and bearish for the equity group -- at least perhaps for the first 15 minutes following the report's release.
Actually, monitoring monthly retail sales makes the most sense when individual investors are making long-term decisions, not short-term ones. The economics say a lot to a lot of people, including individual investors looking to measure specific companies against industry trends.

