Crude oil prices surged on September 15 causing bond yields to rise and stock prices to plunge. Oil then receded before spiking back up to the $37 per barrel level on October 12 in reaction to mounting events in the Middle East. Neither Federal Reserve policymakers nor financial market players really believe that crude oil prices alone will lift the underlying inflation rate. Yet Fed officials maintained their bias that focuses on the "heightened inflation risks" in the U.S. economy when they convened in early October for the Federal Open Market Committee (FOMC) meeting.
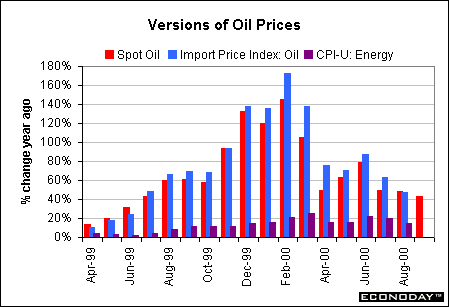
Crude oil prices bottomed out at the end of 1998 and beginning of 1999. West Texas Intermediate averaged $11.98 per barrel in December 1998. Prices were relatively stable in January and February 1999 but began to climb in March of that year. (The chart begins with April 1999 data because this is the first month when year-over-year changes in crude oil were positive rather than negative.) Note that West Texas Intermediate crude oil prices increase in tandem with the import price index for petroleum products. However, energy prices in the CPI rise by a mere fraction of that amount. (We also looked at the finished energy prices in the PPI but they were practically identical to the CPI.) This helps to explain why rising oil prices have not caused as much concern for Federal Reserve policymakers or financial market players the past couple of years. Apart from the fact that oil prices are volatile, they haven't seeped into the price structure of the U.S. consumer.
While various economic events might have different implications for bond or stock investors, it seems that all agree on one thing: inflation is bad for all investors. It is the primary concern of the Federal Reserve these days to focus on the potential for inflationary pressures, as this economy will enter its eleventh year of expansion in March 2001.
This article discusses the major inflation indicators and considers whether inflationary pressures are indeed accelerating or whether market players and Fed officials have little to worry about.
What is inflation, really?
Simply defined, inflation is an increase in the general price level. No question that at any point in time, you can find the price of a good or service that has consistently risen year after year. Medical care fits this description. But you can also find an alternative good or service that has decreased year after year. High technology goods such as computers fit the bill here. So do we have inflation or deflation?
The key is that we are concerned about the general level of prices - or put differently, average prices for a variety of goods and services. Given that definition, we'd have to say that the U.S. has produced inflation on a yearly basis practically every single year in the postwar period. Yet, if we look at the composition of goods and services, we can find indications of deflation many times in the past 30 years - even recently.
Why is the Fed worried about inflation now?
When the U.S. economy is operating at full throttle, it is difficult for it to grow more rapidly when there is a lack of available workers. The only way for an employer to find additional help is to raid their neighboring producer and hire away her workers. This is done by offering higher wages or more benefits or perkier perks. No matter how you slice it, it costs the employer more money. Increased production costs are generally passed on to consumers. Ergo, that's the inflation.
Fed chairman Alan Greenspan and his fellow policymakers closely monitor a labor market indicator that measures the available labor supply. This measure has steadily decreased in the past several years. In September 2000, it reached a new lifetime low. It is no wonder that the Fed is worried about potential inflation.
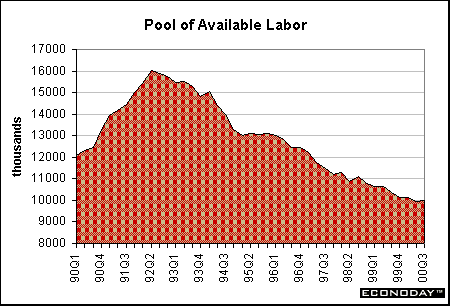
Federal Reserve officials are concerned that the higher wages of the past few years will have to result in higher consumer prices eventually. The next few sections will cover some key inflation indicators that policymakers at the Federal Reserve, as well as financial market participants, are following closely in order to assess the prospects for future inflation.
It begins with commodity prices
Commodities are the raw materials that producers use to make the goods that will eventually be sold to consumers. Commodities are highly competitive goods and easily tradable with foreign countries. As a result, world demand for these goods is equally important to domestic demand. The chart below shows the Journal of Commerce (JOC-ECRI) commodity price index. Yearly price increases peaked in January 2000 due primarily to gains in petroleum products. But metals prices also peaked at roughly the same time.
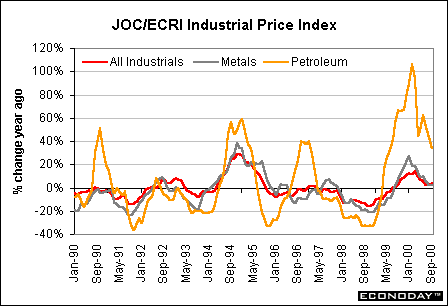
Metals, oil, and textiles are the three primary components of this index. Oil is still up sharply from a year ago. Metals are higher than a year ago, but rising more slowly. In contrast, prices of textiles have accelerated sharply since June, although they had been dropping like a lead balloon during the previous five years. What can this index tell us? Commodity prices are rising rather than falling these days, but it does seem like the worst run-up may be over. With manufacturing activity moderating in the U.S., it is possible that commodity prices will stabilize in coming months.
Competition from abroad: import prices
American consumers benefited from the misfortunes of others in the late 1990s. Recessions in Southeast Asia and even sluggish economic activity in Europe curtailed global demand for goods. Perhaps U.S. shores weren't flooded with cheap imports on the heels of the 1997 Southeast Asia debacle, but we did get goods at lower prices than would have been the case in a stronger global environment.
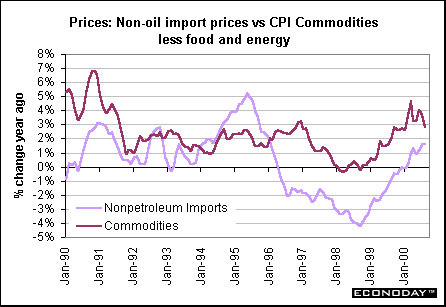
The chart above shows that non-oil import prices began to post year-over-year gains at the beginning of this year. The yearly gains appear to be flattening out, though. Notice that the nonfood, nonenergy CPI commodity index has mirrored the import price index since 1997, although its decline in 1997 and through 1998 wasn't as quite steep while its acceleration since has been somewhat more rapid.
Producer prices at various stages of production
Economists and financial market players closely follow the producer price index for finished goods as a precursor of consumer price inflation. In reality, the PPI for finished goods is not much of a leading indicator - more like a coincident indicator. Similarly, the PPI for intermediate goods and supplies along with the PPI for crude materials are followed as leading indicators. They tend to move at roughly the same time - the lead-time is usually one or two months at the most.
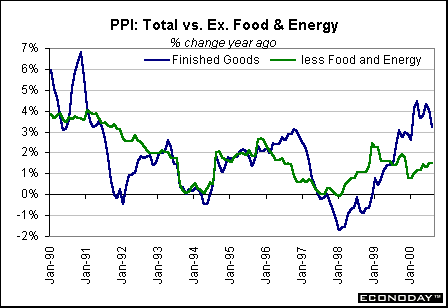
Yearly gains in the producer price index (PPI) peaked in early 2000 as oil prices posted their largest gains early this year. Yet annual increases in the PPI excluding food and energy prices peaked nearly two years ago. Yearly gains have moderated, although spikes in tobacco prices lead to spurts in the core PPI from time to time.
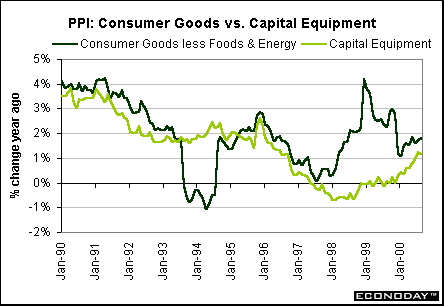
The acceleration in prices of consumer goods (less food and energy) during 1999 and 2000 was concentrated in tobacco products. Tobacco product prices were up 10.6 percent in August 2000 versus year ago levels. Other consumer products that have posted yearly gains of more than 2 percent include book publishing, household flatware and drug prices. Although rising more slowly than consumer goods, capital equipment prices turned up in 2000. Most of the components within capital equipment are posting modest gains from a year ago. The largest of these is civilian aircraft with a yearly rise of 6 percent. Electronic computer prices are down 15 percent from a year ago and communication equipment is down 1.2 percent from last August. It is disconcerting to see price gains in capital equipment since these have typically risen more slowly than consumer goods. Falling computer prices are helping but can't keep the index below the zero mark in total.
Inflation from the Labor Markets
Business costs are curtailed when labor costs are not accelerating rapidly. This is good because producers don't have to raise consumer prices (less inflation) and corporate profits are higher (and so are stock prices).
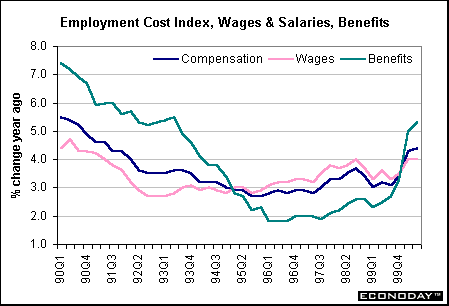
The employment cost index is the most comprehensive measure of compensation costs. Total compensation measures wages and salaries as well as the costs of benefits. Wages and salaries were accelerating through the middle of 1999 and then began to rise more slowly than benefits. Health care benefits are the fastest rising component (relative to perks such as vacations). The acceleration in compensation costs is not well received by financial market players or Federal Reserve policymakers. The only saving grace is that productivity gains are still higher than compensation costs. (See chart below.)
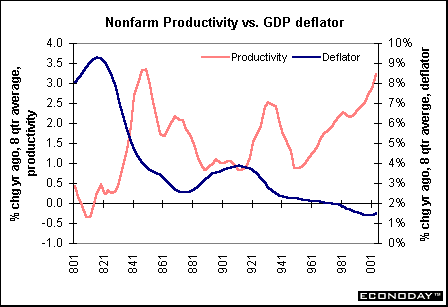
When workers produce more goods, their increased wages aren't an additional cost to the producer. Thus increases in nonfarm productivity allow higher wages without triggering accompanying hikes in consumer prices. Nonfarm productivity is cyclical, but the trend in productivity has improved dramatically in recent years. The chart above is an 8-quarter moving average of the series - which tends to be jagged on a quarterly basis. Note that the GDP price deflator is still headed lower on a long-term basis. (This is also an 8-quarter moving average of the series.) Higher productivity helps to curtail inflationary pressures. We are still benefiting from productivity gains.
Consumer Price Inflation
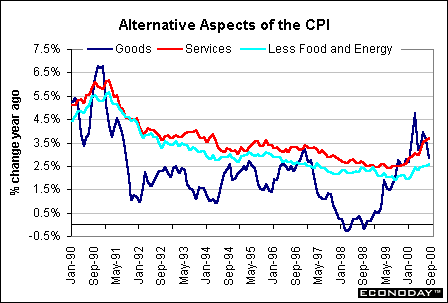
The consumer price index accelerated throughout 1999 and part of 2000 due to surging oil prices. The first chart in this article, which compares oil prices at different stages of processing, reveals that higher oil prices are not the main source of inflation for the U.S. consumer. The chart below shows how price inflation is divided between goods and services (the core CPI is also shown). Note that the spurt in goods prices (roughly 42 percent of the CPI) is due to accelerating oil prices. Apart from oil, tobacco prices have contributed to the hike. Notice how the service component of the CPI (58 percent) correlates with the core CPI (less food and energy, about 75 percent of the total). As prices of services continue to edge up, it will boost the core component and this will worry Fed officials. If commodity prices start declining again, that would dampen the CPI, but our charts depicting commodity prices at earlier stages of processing show a stabilization at best -- not a declining trend.
The following charts show various combinations of the major CPI components.
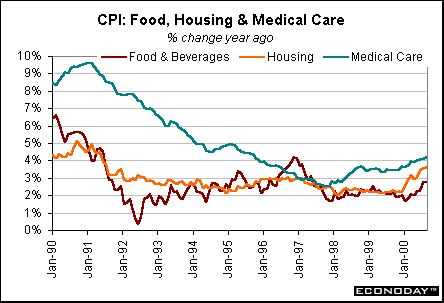
The rising costs of medical care have eased significantly this past decade. Notice that medical care prices were rising nearly 10 percent a year in 1991 and have moderated to a 4 percent rate recently. Both food prices and housing costs had been stable until 2000. Indeed, all three of these series show a marked upward trend in prices since the beginning of this year. Keep in mind that a portion of the rise in housing prices comes from the energy sector (fuel costs).
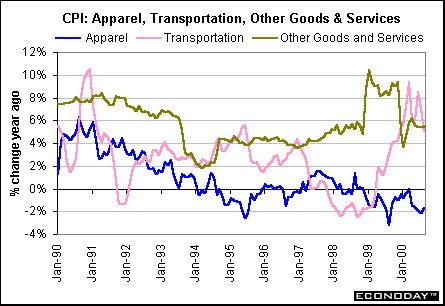
Transportation costs include gasoline, which causes monthly volatility. Apparel costs remain modest still showing yearly declines. The other goods and services category includes tobacco products, where prices again have been increasing rapidly every year.
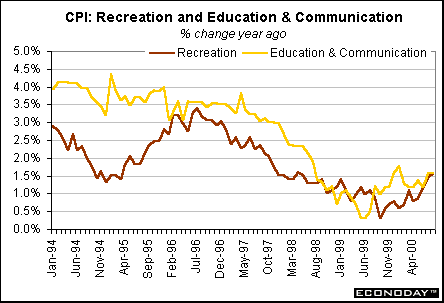
The Bureau of Labor Statistics began to account for recreation, education and communication costs in this format only since 1994. Note that both costs were headed lower through most of this time frame - until this year. It is the education portion of "education & communication" which is causing the price run-up the past year. Communication includes computers and telephone where prices continue to head down over time.
What does the consumer price index tell us? It does appear that many prices are rising a bit faster than they were a year ago. In the past seventeen months, the Federal Reserve raised its federal funds rate target 150 basis points. It now appears that economic activity is slowing down with softer consumer spending and manufacturing activity. It may take a few months to show up in the consumer price index so that the CPI might actually pick up a bit in the next few months, before it moderates again.
THE BOTTOM LINE FOR INVESTORS
Inflation is bad news for all investors because it erodes the value of our portfolios. Our purchasing power for goods and services is diminished over time when the rate of inflation accelerates.
If the Federal Reserve believes that inflationary pressures are likely to accelerate in the near term, they could raise the federal funds rate target one more time. In the short run, this could hurt portfolios because equity and bond prices would both fall. However, nipping inflation in the bud helps long-term portfolio values - keeping up their purchasing power.

