|
Today's Calendar |
| | Simply Economics |
| | International Perspective |
| | Resource Center |
|
| 1999 Articles |
|
By Evelina M. Tainer Chief Economist, Econoday Earthquake rocks Taiwan and US markets
Every little thing rocks the markets in today's environment When market activity has overextended its bounds, minor reasons are necessary to lead to price declines. These days, market players are anxious that the Federal Reserve will tighten monetary policy further soon. The Fed could raise the federal funds rate target as early as October 5 when it meets for the next FOMC meeting. Most economists are not predicting a rate hike at that time. Many analysts expect the Fed to wait until the November meeting. It almost would be better, for the sake of the market, if the Fed did raise rates in October and be done with it. If the Fed doesn't raise rates, market players will only increase their uncertainty - and anxiety - level. This means that a skittish stock market with sharp moves in either direction are a strong possibility in the next several trading sessions. 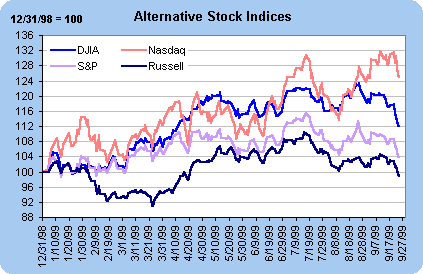 There is no question that the market showed a healthy correction this week in stock prices. Those investors who got in the market in the final two weeks of August can't be too pleased with their stocks underwater. But long term investors will focus on the market's climb since the end of last year. No matter how you slice it, the NASDAQ composite is still zooming at breakneck speed even after this week's 130-point correction. The Dow is up 12 percent since the beginning of the year - a respectable showing. The broader S&P 500 index is not performing as well with about a 3.9 percent gain since the beginning of the year. But the loser is clearly the Russell 2000, which measures small capitalization stocks. It now stands 1.2 percent below the December 31, 1998 close!
Treasury market not putting high probability on Fed rate hike now 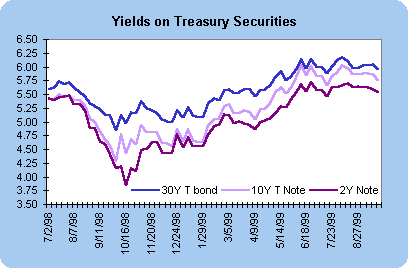
Trade deficit frightens market players 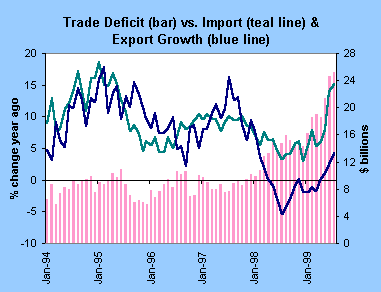 In the past few months, import demand has shot up even more dramatically with a 3.9 percent hike in June alone. July's rise in imports appeared more moderate at 1 percent. One would expect that the latest gains in imports were coming from higher crude oil prices. Actually, the recent gains in crude oil or petroleum products are not the bulk of the demand. Consumer goods (both auto and non-auto) account for a big portion of the rise. Capital goods and industrial supplies also have contributed to the demand for imported goods. This explains why the domestic manufacturing sector was sluggish in the past year and is only beginning to recuperate. Exports have posted modest gains in the past several months. The chart above reveals that export demand bottomed out in mid-1998. After a minor plateau earlier this year, export demand has resumed its growth. This is coming from improved economic conditions in Europe and Asia. 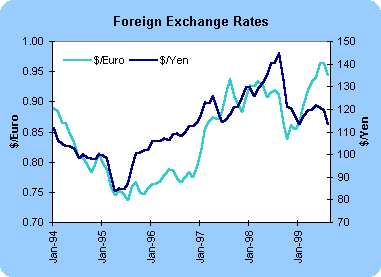 The stronger economic activity in Europe and Asia will further help boost exports in the coming year. The dollar has weakened in the foreign exchange markets - particularly against the yen. A weaker currency helps to spur exports and hamper the demand for imported goods (because these become more expensive). Typically, a lag of six to eighteen months exists before the weaker currency translates into stronger exports and weaker imports. Initially, though, the weaker dollar will generate a larger trade gap because the trade deficit is measured in dollars. It will take more dollars to pay for the goods that were already ordered months ago. The bottom-line on the trade deficit? The larger trade deficit has advantages and disadvantages. In the short run, it implies a larger drag on GDP growth and means slower domestic production. That would be favorable if it meant slower economic growth on the whole. However, the weaker dollar implies inflationary pressures, which could worry the Federal Reserve, and create an environment for higher interest rates.
Federal budget surplus higher than last year 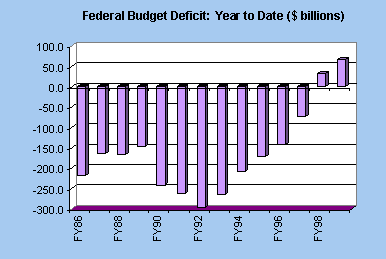 The bottom-line on the federal budget? This will be the second year in a row in which the US has experienced a budget surplus. It has created some interest in tax cuts in Congress, although Clinton has promised to veto the Republican-based plans. A surplus implies reduced borrowing needs by the Treasury. The US Treasury has already reduced various issues of Treasury securities in the past two years. As the supply of Treasury bills, notes and bonds diminishes, the fixed income market will find upward pressure on the prices of these securities and downward pressure on their yields.
Looking Ahead: Week of September 20 to 24
Tuesday
Wednesday
Thursday Economists are predicting no change to the final estimate of real GDP growth for the second quarter. Last month's estimate showed a 1.8 percent rate of growth for the period. Market players will be focused on growth for the second half of the year. They are concerned about the uncertainties surrounding Y2K planning. The Chicago purchase managers index is expected to increase marginally in September to 56.7. While the overall level of activity is important, market players will also monitor the prices paid component, which stood at 63.8 last month. New home sales are predicted to decline about 3 percent in August to a 950,000-unit rate. Housing activity has surprised economists and market players for its strength in the past year.
Friday The NAPM index is expected to remain nearly unchanged in September at 54.5 - compared with the 54.2 level in August. The level of activity will worry market players less than the level of the prices paid index. In August, the price index stood at 59.8. An increase in this index would be bearish for the markets. Construction expenditures are expected to edge up 0.4 percent in August. This reflects a partial offset to last month's drop, which had taken economists and market players by surprise. |
|||||||||||||||||||||||||||||||||||||||||||||||||||||||||||||||||||||||||||||||||||||||||||