
|
Today's Calendar |
| | Simply Economics |
| | International Perspective |
| | Resource Center |
 |
|
| 1999 Articles |
|
By Evelina M. Tainer Chief Economist, Econoday Fed tightening fears keep markets on edge, despite friendly inflation news
Hurricane Floyd impacts trading on Thursday It is unusual that financial markets close because of severe weather. All the major stock exchanges remained open this week, but the cash bond market closed early on Thursday, as did the Chicago Board of Options Exchange. Mayor Giugliani of New York recommended that businesses close at noon. Indeed, several Wall Street firms did close early. So, even though the stock exchanges remained open, thin trading had to skew equity prices for the day. The Chicago Tribune reported that estimated damages from Hurricane Floyd range anywhere between $2 billion and $8 billion. While the estimated damages are large, these would not be the worst suffered from weather or earthquake disasters. Hurricane Andrew (August 1992) was estimated to cost $15.5 billion dollars, while the Northridge, California earthquake of January 1994 was estimated to cost $12.5 billion in damages. Incidentally, some have argued that the rebuilding from an earthquake or hurricane disaster boosts economic growth. Sure, it does in the near term. But remember that those resources had alternative uses. Rebuilding perfectly good homes or roads after a disaster doesn't add to the nation's wealth. Moreover, It is useful to remember that business associated with tourism is not replaceable.
Market players are skittish about Greenspan 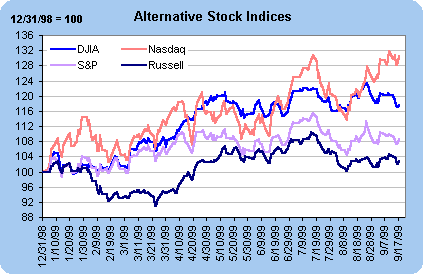
CPI reflects surge in energy prices, not elsewhere 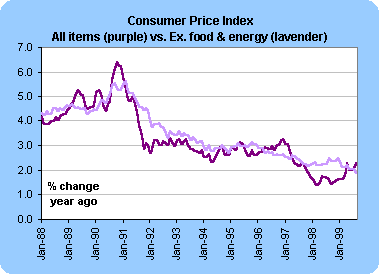 Excluding food and energy prices, the CPI inched up 0.1 percent in August, after a 0.2 percent hike in July. This puts the core CPI 1.9 percent above year ago levels. As evident in the chart above, the core components of the CPI are exhibiting a downward trend. 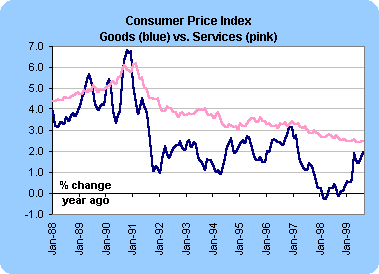 We like to look at the price changes in goods versus services. The uptick in goods inflation is due entirely to the surge in energy prices. Excluding food and energy from the good component leaves us with a year-over-year gain of 0.2 percent. While consumers clearly feel the impact of rising energy prices at the gas pump, prices of everyday goods don't seem to be rising. The downward trend in consumer prices for services is quite interesting as well. The bulk of consumer spending is on services. The bottom-line on the CPI? The inflation news remains favorable. Short-term spikes in energy prices don't mean that prices of all goods and services have to rise. The Federal Reserve cannot point to this inflation index as a reason for further rate hikes at this time.
Consumer optimism helps boost retail spending 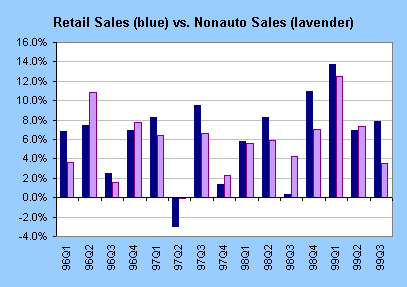 While retail sales were quite robust in August, a slowdown in June and July is holding down the third quarter average. With only September figures missing, total retail sales did accelerate in the third quarter, but non-auto retail sales are much softer for the period. This will help to hold down the consumption portion of GDP for the third quarter. The bottom-line on retail sales? Retail sales turned up in August after a couple of less robust months. Consumer spending may be somewhat more moderate in the third quarter than the second, but confidence remains quite high. The University of Michigan's consumer sentiment index rose in September for the mid-month reading from August levels. The Fed is looking for slower economic growth so that inflationary pressures won't develop. They certainly couldn't have been reassured by the August retail sales report.
Housing finally trending lower? 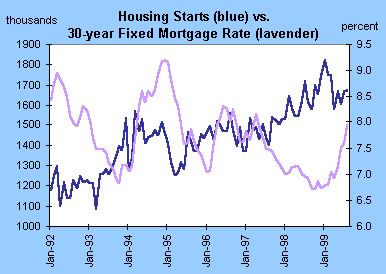 The bottom-line on housing? Housing starts were stronger than expected in August, but signs of slower growth are becoming evident. For instance, the NAHB housing index, which surveys home sale traffic, shows a downward trend over the past six months. Less housing construction also translates into lower spending for furniture and appliances. This will hamper retail sales in coming months. By the way, September housing starts will be hurt by the impact of Hurricane Floyd. Conversely, October and November starts might be boosted by reconstruction due to the hurricane.
Production softens in August 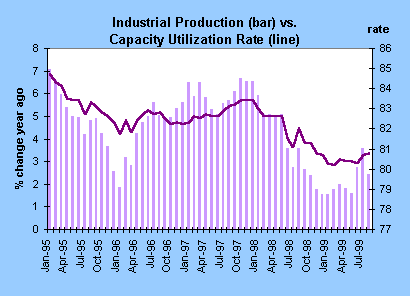 The bottom-line on industrial production? Gains have been modest in the past few months. New orders figures have pointed to some improvement, but the increases are limited to few sectors (computers, motor vehicles). The capacity utilization rate has ticked higher in the past few months, but still remains well below "danger zone" levels (which would be around 84-85 percent). The Philadelphia Fed's business outlook survey (a leading indicator of production) did pick up in September, but gains in this survey were not uniform across categories. This should not cause Fed officials to worry about excess growth.
THE BOTTOM LINE The Fed is concerned about the potential for inflationary pressures coming from a robust economy. Even though the CPI was sanguine, market players couldn't decide on what side of the fence the Fed would be leaning as they approach the October 5 FOMC meeting. Our view is always that Fed officials don't make their decisions until they are at the meeting. They analyze all possible information at their disposable. Economic news will be sparse next week. It could create more skittishness than usual.
Looking Ahead: Week of September 20 to 24
Tuesday
Wednesday The Fed's Beige Book will be reported. Economists and financial market players will be looking for anecdotal evidence on moderation in the economy.
Thursday |
|||||||||||||||||||||||||||||||||||||||||||||||||||||||||||||||||||||||||||||||||||||||||||