
|
Today's Calendar |
| | Simply Economics |
| | International Perspective |
| | Resource Center |
 |
|
| 1999 Articles |
|
By Evelina M. Tainer, Chief Economist Employment situation could set negative tone for month
Equity prices neutral to lower 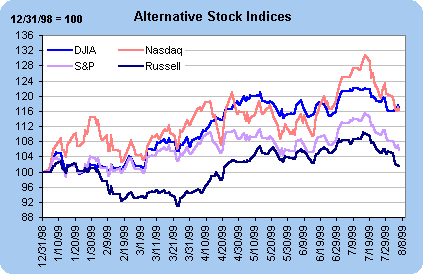 Summing Up: It's the summer doldrums. Investors have seen downdrafts in July and August in the past few years and are probably concerned that a shock will set off the market this year as well. Certainly, anything can happen. The likelihood of a rate hike in August is not bullish for the equity market in general. Investors won't get any good news in the near term and anticipate third quarter earnings reports.
Quarterly refunding announcement by Treasury aids prices In addition, the government announced plans to buy-back Treasury securities. The idea is to buy back those issues that have higher yields. It is basically the government's attempt to refinance their loans and pay down the national debt, which stands in excess of $5 trillion. A reduction in the supply of Treasury securities will almost certainly lead to an increase in their price. But most prices are set by the combination of supply and demand. Recently, many analysts were worried that foreign demand of U.S. Treasury securities would drop precipitously, as foreigners became more interested in their own economies in Europe and Asia. If the supply of Treasury securities becomes limited, the problem caused by the weaker foreign demand is also limited. Some analysts are worried that the depth of the Treasury market would be reduced with a buy-back and it would hurt liquidity. That is always a possibility. In any case, the U.S. Treasury market probably has a way to go before the supply becomes "too small." 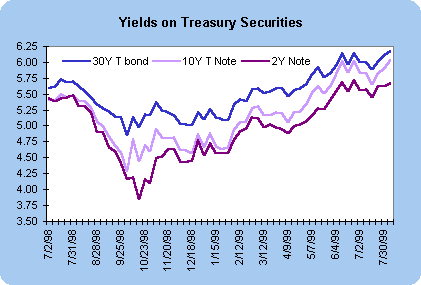
Employment situation shows strong growth; higher wages 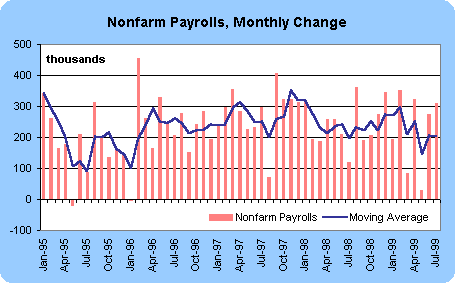 Often, such large gains cause economists to analyze the data with a fine-tooth comb - searching for "special factors" that may have skewed the figure one way or another. Manufacturing employment increased for the first time since August 1998, but no special factor can account for it. Perhaps the recent gains in new orders suggest better trends in factory employment (although the underlying pattern of factory orders was more anemic than the headline figures.) In the service sector, a spurt of activity occurred in retail trade - eating and drinking places added to their payrolls in a big way (+61,000). But this sector does tend to move in spurts. The longer-term trend is not suggesting the data is misleading. The bottom line on this payroll figure? It suggests economic activity is not moderating and the Fed will pounce on it as an excuse to tighten monetary policy as a pre-emptive measure against inflationary pressures. The civilian unemployment rate was unchanged in July at 4.3 percent as both household employment and the labor force decreased modestly. It isn't unusual to see a divergence between household employment and nonfarm payrolls from month to month. On the whole, the two employment series do move in tandem. More disconcerting for financial market players and Fed policy-makers was the 0.5 percent spurt in average hourly earnings. On a year-over-year basis, earnings rose 3.8 percent in July compared with 3.7 percent in June. This shouldn't be a big deal on its own. However, if you look at the monthly changes in hourly earnings, the pattern of the past four months is not pretty. (Monthly increases from April to July: 0.2, 0.3, 0.4 and 0.5 percent.) On their own, these figures might not be the beginning of an inflationary trend, but the Fed will want to act in a pre-emptive fashion. 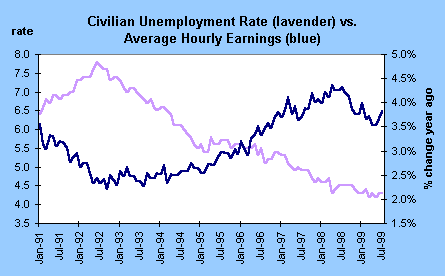
Productivity moderates in quarter; unit labor costs accelerate In reality, the productivity figures weren't all that bad. Indeed, since productivity depends on quarterly GDP growth along with changes in employment for the period, the numbers are always volatile. It makes more sense to view them as year-over-year changes. Indeed, nonfarm productivity increased 2.9 percent from a year ago - posting its largest gain since the second quarter of 1996! The chart below depicts the year-over-year change in nonfarm productivity along with the yearly change in unit labor costs. In a similar vein, the yearly rise in unit labor costs was more moderate than the quarterly one. The three-quarters just ended have shown the smallest three-quarter change in unit labor costs since 1996. 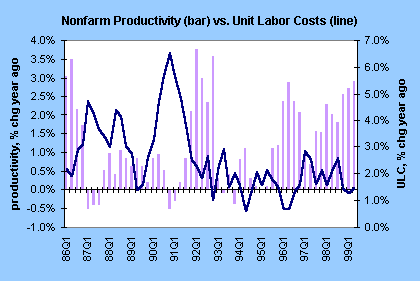 The bottom line on productivity and unit labor costs? The data are still showing healthy productivity trends, but the quarterly figures were sufficiently bearish that the Fed could point to them as reasons to raise rates.
Once over lightly Motor vehicle sales were on par with June levels - showing healthy spending on the part of consumers. Also, chain store sales posted healthy year-over-year gains in comparable stores. This is somewhat at odds with the weekly LJR Redbook and BTM/Schroders chain store sales indices, which actually were down for the month.
THE BOTTOM LINE The employment report reflects a robust economy - with signs that wages are beginning to accelerate again. At the same time, productivity growth moderated significantly in the second quarter (looking at the quarterly pattern, rather than the yearly pattern). This is cause for concern. Market players interpreted the economic data to imply that the Fed would soon be raising the federal funds rate once again by 25 basis points (or maybe even more) at the upcoming FOMC meeting.
Looking Ahead: Week of August 9 to 13
Thursday Retail sales are expected to rise 0.3 percent rate in July, a bit more than the 0.1 percent gain posted in June. Excluding autos (and trucks), sales should post a 0.5 percent gain for the month. Non-auto retail sales rose 0.4 percent in each of the previous two months.
Friday Market players are looking for business inventories to edge up 0.2 percent in June, about in line with the past few months. Manufacturing inventories were down in June. Wholesale trade inventories will be available on Monday. |
|||||||||||||||||||||||||||||||||||||||||||||||||||||||||||||||||||||||||||||||||||||||||||