
|
Today's Calendar |
| | Simply Economics |
| | International Perspective |
| | Resource Center |
 |
|
| 1999 Articles |
|
By Evelina M. Tainer, Econoday Chief Economist Employment cost index frightens bond and equity investors
Equity prices higher than year-end, but oh the pain from the July peak! 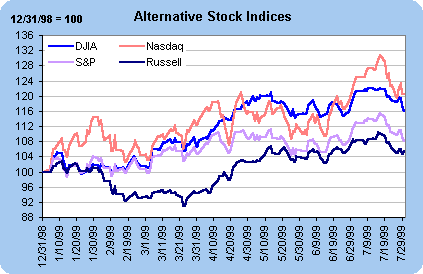 Dow Jones Industrials Average: The DJIA dropped 323 points over a two day period as fears of inflation made investors rethink prices. The index had peaked at 11209.84 on July 16, posting a 22.1 percent gain since year-end. But the past few weeks have hurt the Dow - despite good earnings reports. As of today, the Dow is up 16.1 percent since December 31, 1998. This reflects not only a drop from the mid-month peak, but also a drop since June 30. S&P 500: The S&P increased less dramatically over the course of this year, and declined more sharply than the Dow since its peak. Through July 16, the S&P 500 was up 15.4 percent from 12/31/98; now it is up a more moderate 8.1 percent. NASDAQ composite: Tech stocks have dominated the news these past couple of years and this composite index has surged. Through July 16, when the index peaked at 2864.50, it posted a 30.6 percent gain since 12/31/98. The index has since decreased 7.9 percent from its peak and is now up 20.3 percent since the end of the year. Russell 2000: The Russell 2000 is the laggard among the group. It never regained its peak from last year. It was only starting to post year-over-year gains. The Russell reached this year's high on July 15 at a level of 465.80, and was 10.4 percent higher than its level on 12/31/98. The index has since fallen 4.5 percent (although it was the only stock index up today!) from its near-term high. The index now stands 5.4 percent above year-end levels. Summing Up: If you bought at the peak on July 16, you are surely smarting from the pain. But when one takes the long-term perspective (as a long-term investor), then it remains the case that market activity is quite healthy this year. Returns of the magnitude indicated through July 30 aren't shabby even for the year, and we have five months to go.
Potential inflation and Fed rate hike lead to higher interest rates 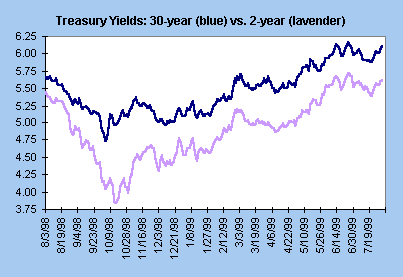
Employment cost index jumps in second quarter Some analysts discounted the spurt as inconsequential because particularly large gains were posted in only a couple of sectors (finance, insurance and real estate; retail trade; wholesale trade; and transportation and public utilities). While we shouldn't always discount "special factors", it is useful to note that the gains in these sectors were offsetting unusually meager gains in the first quarter. On average, they were in line with the previous periods. Quarterly changes in the employment cost index - whether looking at the wages and salaries or the benefits component - are unusually volatile. As a result, we find it more useful to look at the year-over-year change. By that measure, the ECI didn't look so bad - posting a 3.2 percent gain in June compared with a 3 percent gain in March. And even with the uptick, it remains below the yearly gains of the previous year and a half. The longer-term perspective on this index shows that employment costs remain relatively subdued. 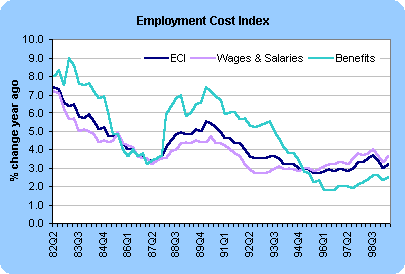 We ask ourselves two questions on this report. Does it suggest that wage pressures are accelerating? Objectively, one quarter doesn't make a trend. The second more important question is this. What will the Fed do with this information? Alan Greenspan testified before the House Banking Committee last week and again before the Senate Banking Committee this past week. He said the same thing. The Fed intends to be pre-emptive against inflation if they see signs of it. They also want to nip inflation in the bud before it has a chance to worsen dramatically. The Fed is likely to use this opportunity of a spurt in the employment cost index to raise rates at the August 24 FOMC meeting. It will show that they are acting in a pre-emptive fashion. It could do the trick for the year.
GDP slows down; is it for real? 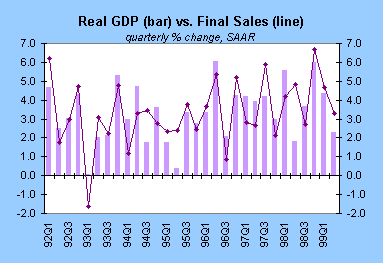 Just about all sectors of the economy moderated in the second quarter. Personal consumption expenditures increased at a 4 percent rate after surging at a 6.7 percent rate in the first quarter. Investment in residential structures rose at a 5.1 percent rate - one-third the pace recorded in the first three months of the year. In contrast, business fixed investment spending expanded more rapidly in the second quarter. This was entirely due to a surge in producers' durable equipment (+15.3%) where gains were particularly healthy in computer-related products. Investment on nonresidential structures actually declined at a 1.2 percent rate. The foreign sector was a drag on growth once again, but at a slower rate than the previous quarter. Exports increased 4.5 percent, reversing much of the first quarter drop. Moreover, imports grew at a slower rate after two robust quarters. Government spending decreased in the three months ending June with declines in both defense and nondefense spending on the federal side. State and local government spending was unchanged for the period. Most interesting was the sharp moderation in the rate of inventory accumulation. Nonfarm business inventories were generally growing at the same pace over the past four quarters, but all of a sudden shifted into lower gear. Manufacturing inventories actually decreased for the second straight quarter. Retail trade inventories swung from an accumulation of $16.1 billion in the first quarter to $1.1 billion in the second. Normally, a drop in the rate of inventory accumulation accompanied by a healthy rise in final sales signals some production acceleration in coming quarters. Once again we - and the Fed - are faced with an interesting dilemma. Greenspan had suggested that the Fed would raise rates if economic growth were dangerously high. In fact, real GDP growth slowed dramatically this quarter. But since so much of the slowdown came from the inventory sector - which normally signals production gains - this is not exactly a formula for a slam-dunk. To top it off, the GDP deflator rose at a 1.6 percent rate for the second straight quarter (largely due to gains in energy prices.) Sometimes "headline" numbers are misleading. It is probable that the second quarter GDP falls in that category.
Home sales spurt in June 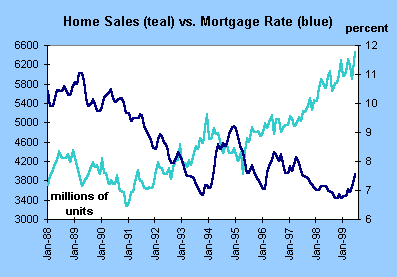
Durable goods still sluggish 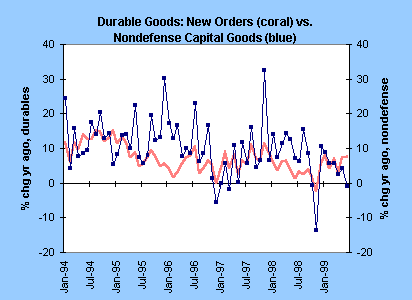
THE BOTTOM LINE The employment cost index may have jumped in the quarter, but the longer-term trends indicated by the year-over-year data don't point to an imminent spurt in inflationary pressures. At the same time, real GDP growth moderated to a virtual halt in comparison to the previous two quarters. Yet again, the underlying drop in the rate of inventory accumulation may give a misleading view of robust fundamentals. Manufacturing activity remains the Achilles' heel of this economy indicated by the sluggish durable goods report. Some signs of life are evident even there, though, as the Chicago purchasing managers' index gained 0.5 percentage points to 60.5 in July. This is a healthy showing for this region. Consumers are the mainstays of this economy. Home sales surged. Consumer confidence is at high levels. Personal income growth is improving. 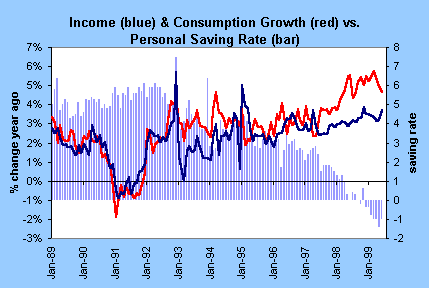 Market players will have their hands full with another set of economic indicators in the coming week. As usual, attention will turn to the employment situation for July. It will set the tone for the month. The rise in interest rates this week coupled with the drop in stock prices suggests that most market players are anticipating a rate hike by the Fed at their next FOMC meeting.
Looking Ahead: Week of August 2 to 6
Monday Construction spending is expected to increase 0.5 percent in June after decreasing in the past two months. The forecasts for this indicator fall in a wide range (-0.6 to +1.6 percent) as usual.
Tuesday
Wednesday Auto sales are expected to run at a 7.0 million unit rate in July, the same as June. Truck sales are predicted to also run at the same 7.4 million unit rate registered in June. Motor vehicle sales were stronger in May. The Treasury's quarterly refunding announcement will take place today for 5-year and 10-year notes, as well as the 30-year bond.
Thursday Nonfarm business productivity is expected to rise at a 1.7 percent rate in the second quarter, down from the two previous periods when productivity increased in excess of 3.5 percent per quarter. Market players are looking for unit labor costs to increase at a 2.5 percent rate, at a much more rapid clip than the first quarter's pace of 0.7 percent.
Friday Market players are looking for consumer installment credit to rise $6.2 billion in June after a $12.1 billion spurt in May. |
|||||||||||||||||||||||||||||||||||||||||||||||||||||||||||||||||||||||||||||||||||||||||||