
|
Today's Calendar |
| | Simply Economics |
| | International Perspective |
| | Resource Center |
 |
|
| 1999 Articles |
|
By Evelina M. Tainer, Econoday Chief Economist Good inflation news; moderately healthy economic growth
Equity prices follow upward path 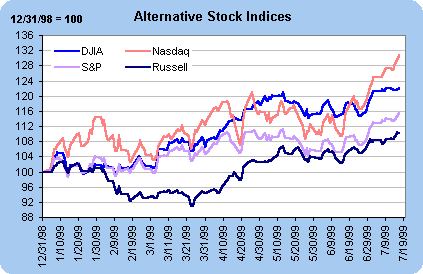 The S&P 500 and the NASDAQ composite ventured into new territory several times this week. The S&P had not increased as dramatically as the Dow in the first half of the year, so this "catch up" is not unusual. Yet, the NASDAQ continues to outperform other markets surging ever forward. The laggard Russell 2000 index of small cap stocks is increasing on a regular basis. Yet, there is no question that the moves in the small cap sector remain modest relative to the better known blue chip and tech stocks.
Interest rates stable 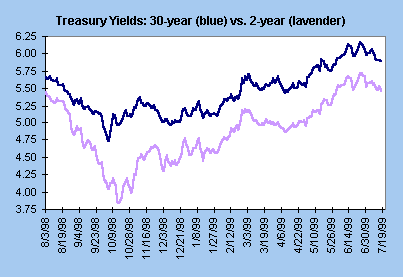
Inflation remains quiescent 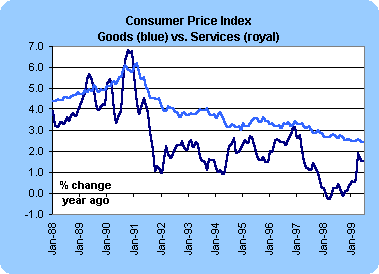 The chart above shows the year over year change in the commodity and service components of the CPI. Note that the tobacco and energy spurt, which lifted the goods portion of the CPI earlier this year is now abating slightly. In addition, the service component of the CPI continues to increase at a slower rate (despite higher wages). There is just no way for the Fed to point to consumer inflation as a reason for raising interest rates at the next meeting. (They might point to something else, though.) The producer price index also was also benign. The total PPI edged down 0.1 percent, while the PPI excluding food and energy prices decreased 0.2 percent in June. On a year-over-year basis, both were 1.5 percent higher than last June. The detailed breakdown showed that prices were generally subdued with many declines in the consumer goods and capital equipment categories. Once again, the news was truly favorable on inflation with no signs of imminent price pressures (aside from the run-up in crude oil prices in recent weeks.) 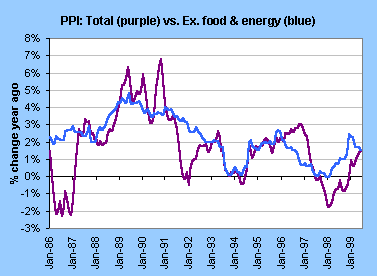 Some bears may point to the gains in intermediate and crude materials in the past few months as a negative leading indicator. Intuitively, one would expect that price hikes at the earlier stage of processing would eventually be passed on to the later stages such as the finished goods index. In reality, price increases generally occur at the same time at all levels of processing. This means that the gains in intermediate and crude materials prices may not necessarily be passed on to the PPI for finished goods. And in any case, both indices are still down from year ago levels.
Manufacturing sector is subdued 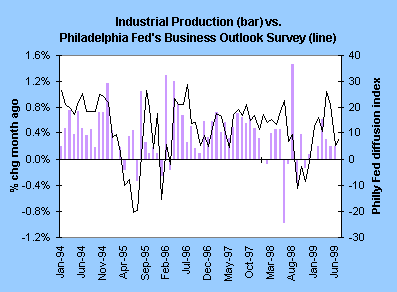 The chart above compares the monthly change in industrial production with the Philadelphia Fed's diffusion index. The Philly Fed index increased to 7.8 in July from 5.3 in July but remains at relatively low levels. Both point to relatively anemic activity in manufacturing although it is increasing (rather than contracting). The industrial sector of the economy can't be suggesting to Fed policymakers that growth is accelerating at a rapid clip. This certainly wouldn't be cause for alarm - or a potential rate hike at the next FOMC meeting in August.
Consumers still spending, albeit at a slower rate 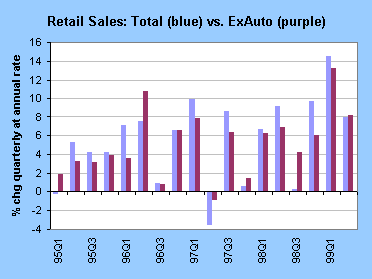 From this week's set of data, this is about the only indicator the Fed could point to as a worrisome spot for over-heating. Nonetheless, the sector did moderate from the previous quarter, so this would not make a strong case on their behalf.
THE BOTTOM LINE Inflation remains quiescent in the near term. There weren't any special factors that necessarily curtailed either the PPI or the CPI. Crude oil prices have risen in the past few weeks - and this quickly leads to price hikes at the gas pump. Yet, this appears to be the only source of price hikes. Moreover, price gains are modest in the past couple of weeks. The bulk of the crude oil price jump came a few months ago. The Fed simply can't point to either of these price measures as a reason for raising rates in the near term. Indeed, the rhetoric in the past month or so has concentrated not so much on actual price pressures, but robust growth, which could lead to inflation. The Fed will be looking for signs of moderation in the next few weeks before the next FOMC meeting. Market players are already anticipating another rate hike. Yet, a question does remain whether the Fed will raise rates at the August or October meetings. The majority are looking for a near term hike, but nothing is a done deal yet!
Looking Ahead: Week of July 19 to 23
Tuesday
Wednesday
Thursday Alan Greenspan is scheduled to address the House Banking Committee for the semi-annual Humphrey-Hawkins testimony. The federal budget is typically in surplus in June as estimated tax payments swell government coffers. In the past two years, the budget surplus was in excess of $50 billion. Economists are looking for a similar surplus of $55 billion for the current fiscal year. |
||||||||||||||||||||||||||||||||||||||||||||||||||||||||||||||||||||||||||||||||||||||||||