Determining the appropriate asset allocation mix for you
How to revise it on economic variables
Evelina M. Tainer, Chief Economist
What is the best asset allocation mix?
First and foremost it is important to realize that there is no single asset allocation mix which can be described as "best". Individuals must determine asset allocation decisions as they consider their financial situations, their long and short term goals, as well as their risk tolerance levels. Consider these two alternatives.
|
Bob is a 25-year-old accountant working for a government entity. He has no debt and no family obligations. Each month, he saves 10 percent of his salary and directs two-thirds of his savings to a money market account and one-third to a stock fund.
Sally is a 25-year-old accountant (with no debt or family obligations) working for a start-up firm in Silicon Valley. She deposits 10 percent of her salary each month in a money market fund. Which is more risk averse? If you said Bob, you're right! Sally has greater risk in the job market because she is working for a start-up firm. She figures it's best to remain liquid and hold cash. The chance of Bob losing his job is much lower given his government job. He could probably afford to save a greater portion of his salary in aggressive stock funds. The fact that Sally is willing to take on more risk than Bob in the job market and less in her investments right now is neither good or bad. It just means that the asset allocation of her investments will reflect her complete lifestyle choice. At the same time, Bob realizes that his risk tolerance for stock market swings is low and reflects his preference in a conservative plan. |
A resource guide Charles Schwab published for its clients shows five alternative scenarios representing different risk tolerances of individual investors. These are a good starting point for consideration. If you aren't sure what kind of risk tolerance you have, you might consider taking a quick quiz on some of the web sites sponsored by mutual fund companies. We tried the quiz on the site for Montgomery Funds (www.montgomeryfunds.com) and Fidelity (www.fidelity.com). They came up with similar results, although their approach was slightly different.
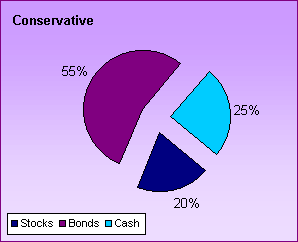
This best serves investors who want current income and stability and aren't concerned about increasing the value of their investments. The stock mix should have 15% large companies, 5% small companies.
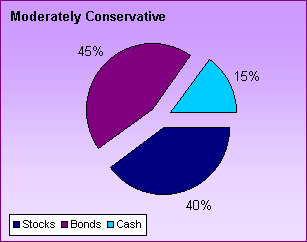
This allocation works best for investors who want current income and stability, with some increase in the value of their investments. The stock portion should be divided further into 20% large companies, 10% small companies, and 10% international.
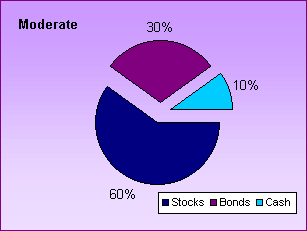
This asset allocation mix works for longer-term investors who don't need current income and want reasonable but relatively stable growth. Some fluctuations are tolerable, but they want less risk than the overall stock market. The stocks should be divided into 30% large companies, 15% small companies, and 15% international.
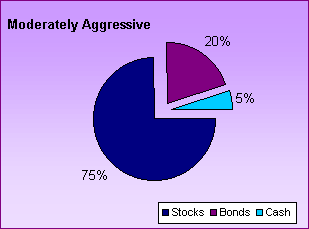
The investment horizon for this allocation mix is greater than 15 years. The plan works best for long term investors who want good growth and don't need current income. A fair amount of risk is acceptable, but not as much as if they invested exclusively in stocks. Stocks should be allocated to large companies (35%), small companies (20%) and international (20%).
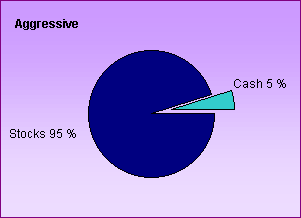
The investment horizon for this allocation mix is greater than 15 years. The plan works best for long term investors who want good growth and don't need current income. Substantial year-to-year volatility in value is acceptable in exchange for a potentially high long-term return. Forty percent of the stock portfolio should be in large companies, 25% in small companies, and 30 percent in international.
How do economic variables affect this allocation?
If an investor were to follow the asset allocation theory to the letter, then they would hardly ever alter their portfolio mix over time, or over the business cycle. In fact, most market strategists for the various investment firms do change their asset allocation recommendations, as they believe economic conditions warrant.
The most basic changes would occur in times of financial turmoil. Turmoil causes investors to turn to cash. Investment professionals consider U.S. Treasury bills as cash. If economic conditions were worsening, then one would expect the stock market to move sideways or decrease in value. This would lead strategists to recommend bonds over stocks as a greater share of the portfolio. If economic growth were accelerating at a rapid clip, then recommendations would favor stocks over bonds.
The Dow Jones Investment Advisor, a monthly magazine for financial planners, features an asset allocation panel of eleven market strategists. They vary in their outlook. As a group, the consensus called for a modest drop in the Dow Jones Industrials Average (from July levels); a significant drop in long bond yields (by roughly one percentage point); slower economic growth relative to the first half of 1999; low inflation (under 2 percent); and stable short term interest rates. Strategists were polled in the last week of July.
What does this give us for an asset allocation mix? For the most part, the allocation is geared towards a less aggressive plan. Indeed, there is a heavy concentration of bonds and cash in this allocation recommendation. Comparing it to the risk tolerance portfolios suggested above, this one falls between moderately conservative and moderate.
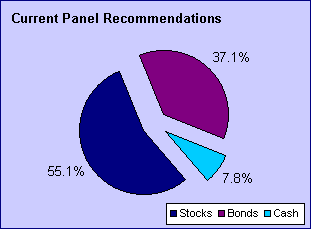
The September issue of The Dow Jones Investment Advisor did have two outliers in the panel. Gary Shilling of A. Gary Shilling & Company was quite bearish on the market. He recommended that only 20 percent of the portfolio be in stocks and a full 20 percent in cash. This recommendation suggests a very dour outlook on economic and market conditions in the next few months. As you can surmise from the baseline allocations, only the most conservative plans seek a 20 percent cash load.
Tom Galvin of Donaldson Lufkin & Jenrette was on the other end of the spectrum with a very bullish view on the market and the economy. Galvin suggested that 80 percent of the portfolio be in stocks with only 5 percent in cash.
Incidentally, this panel appears more optimistic in the July poll from the previous month. The consensus recommendation for the allocation mix put more money into stocks and bonds, and less in cash. A move away from cash generally indicates greater confidence on the part of the strategists.
How to reconcile this forecast with upcoming monthly indicators
The Dow Jones panel predicted GDP growth in the neighborhood of 2 1/2 percent for the second half of 1999. Since GDP is a quarterly indicator, you will have a sense of the pace of economic activity by monitoring the monthly indicators. For instance, GDP growth of this magnitude generally corresponds with nonfarm payroll growth of 150,000 per month. However, if nonfarm payrolls increase at the same pace as the past few months (200,000 + per month), it implies stronger GDP growth than the predicted value.
The strategists were looking for Inflation rates of near 2 percent a year. This translates into monthly gains in the consumer price index of 0.2 percent per month.
Consumer spending accounts for two-thirds of GDP. One way to make sure that GDP growth is moderating is to see slower consumption expenditures. A moderation in consumer spending means retail sales will have to grow about 0.3 to 0.5 percent per month on average. In fact, August retail sales (reported on September 14) jumped 1.2 percent. Even after special factors were removed (such as robust motor vehicle sales and spurt in gasoline prices) sales were still healthy for the month.
All in all, it is useful to monitor the daily barrage of economic indicators to see if trends are keeping up with the expectations of market strategists. Yet it is equally important to put the monthly changes in perspective. Making daily (weekly or monthly) adjustments to the asset allocation mix of your portfolio will not make you a wealthy investor.