The Housing Market
Is it ready to trend lower?
Evelina M. Tainer, Chief Economist
About a year ago, the Blue Chip panel of more than 50 economists predicted that housing starts would decrease about 5 percent from the high levels reached in 1998. What happened instead? Housing starts continued to climb in 1999. Indeed, the first quarter of 1999 showed total housing starts at their highest level since 1986. Even more significant is the dramatic gain in single-family starts, which recorded levels last seen in 1978!
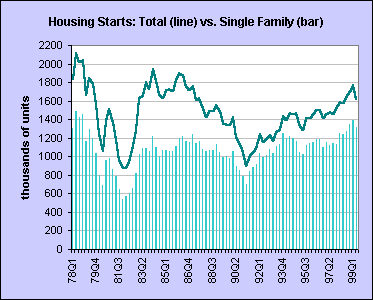
There is no question that a low interest rate environment coupled with relatively stable prices, tight labor markets and a booming stock market has helped to spur the housing industry in the past few years. But the economic environment can't take all the credit. Housing market analysts are now suggesting that the recent gains in housing are due in part to the influx of immigrants that came to the United States in 1990. That particular immigrant cohort has been a major impetus behind home sales in the past year or so. Nevertheless, the Blue Chip panel is now predicting that housing starts will decrease about 7 percent in 2000 from the average pace of 1999.
Current conditions in the housing market
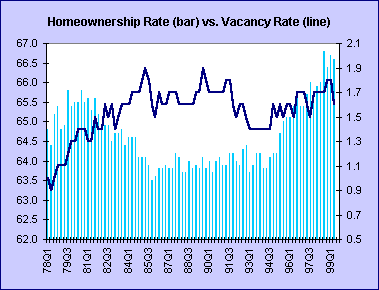
The level of homeownership has dropped modestly in the past couple of months from the peak rate recorded in 1998. Still, homeownership rates remain at all time highs in the history of this series, which began in the mid-1960s. The homeowner vacancy rate has dipped recently, but is not at all time lows suggesting an ample supply of housing units on the market.
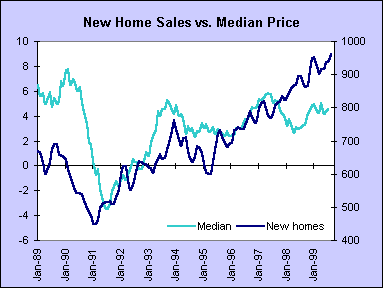
The chart below depicts the rapid growth in home sales in the past ten years relative to the year-over-year changes in median home prices. The chart reflects a three-month moving average of home sales in order to smooth this volatile monthly series. The peak selling rate occurred in November 1998, although the strongest three month selling period was from June to August 1999. After recovering from the 1990-91 recession, the median price of new homes has increased between 2 and 5 percent annually since 1993. This masks more dramatic appreciation in many specific markets. Remember the old real estate adage: location, location, location!
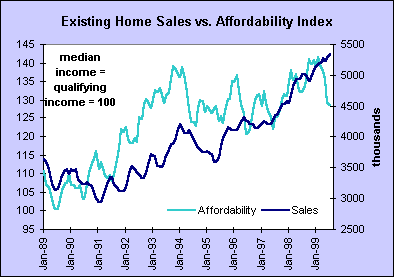
Existing home sales have exhibited the same upward momentum in the past several years as new homes. (Note, though, that existing home sales were more stable than new home sales during the 1990-91 recession.) The affordability index compares median income to qualifying income for existing home sales taking into account home prices as well as mortgage rates. The affordability index ranged between 120 and 140 in the past five years. A short-term perspective might see the drop in affordability in 1999 as indicative of a downward trend in home sales. Actually, the index remains within the range of the past five years. If the index were to fall below 120, it would be more ominous in terms of existing home sales.
Fed tightening first works on housing market to slow economy
When the economy is overheating, and inflationary pressures intensify, the Fed typically tightens monetary policy by raising the federal funds rate target. This leads to higher rates across the spectrum of maturities from 3-month securities to 30-year bonds. The Fed is relying on the fact that higher interest rates will boost mortgage rates - and rising mortgage rates will eventually curtail housing demand. Declining housing demand eventually leads to decreases in demand for furniture and appliances. Consequently, rising interest rates dampen retail sales.
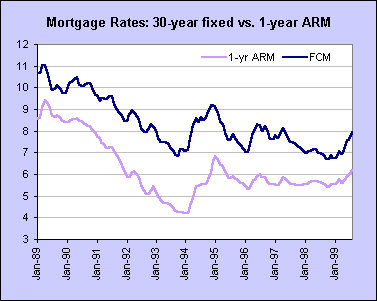
When the Federal Reserve tightened credit conditions this summer by raising the federal funds rate target 50 basis points, they were hoping that the higher rates would hamper rate sensitive markets such as housing and expenditures for consumer durable goods. The chart above compares the one-year adjustable mortgage rate (ARM) to the 30-year fixed rate loan. The spread between the two series has been stable for the past eighteen months. Consumers typically prefer the 30-year fixed loan, but switch to the adjustable rate loan when rates are rising. As a result, rising interest rates have a smaller impact on housing activity today than they did 20 years ago when adjustable rate loans were not the norm. Thus, higher mortgage rates will probably reduce the demand for housing, but not sharply in the near term.
What's an investor to do?
Can investors still earn profits from the housing industry even as demand moderates? Sure, but the homework that every investor should do with each and every investment becomes more important. That is, when the housing industry is in a robust expansionary phase, it almost doesn't matter which stock an investor purchases since "a rising tide lifts all boats." As the market calms down, well run companies could still show stock price appreciation by gaining market share.
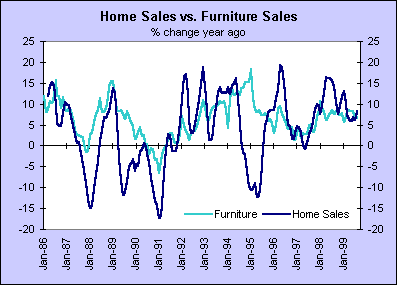
Notice that yearly changes in single family home sales move in tandem with yearly changes in furniture sales. (We have smoothed out the home sales series by looking at its three month moving average.) Furniture sales fluctuate less dramatically than home sales. This is not entirely surprising. Consider that renters also buy furniture. Moreover, consumers may decide to buy furniture instead of new homes when economic conditions moderate because it is less expensive to refurnish their existing property than to move. Even if you don't want to newly invest in furniture companies at this stage of the business cycle, well run companies could still post some healthy profits in the coming twelve months. So if you own stock in a furniture company, make sure to check how it is faring relative to the industry.
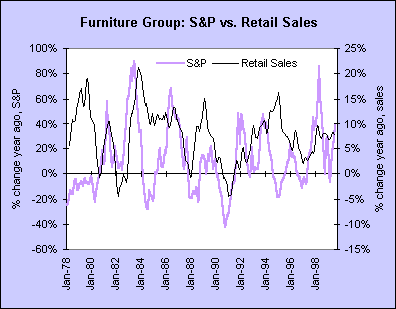
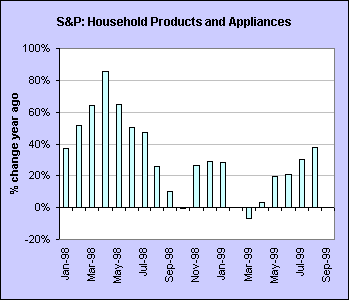
The chart above compares yearly changes in the S&P for furniture and appliances to the yearly changes in furniture retail sales over several business cycles. The chart below shows the yearly change in stock prices for furniture and appliances over the past couple of years. Notice how annual gains have diminished in 1999.
Construction also includes the nonresidential sector
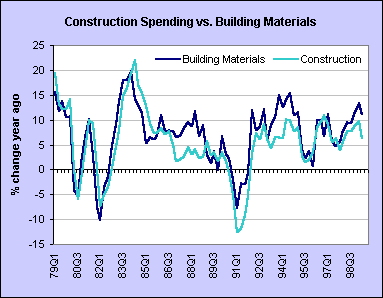
Construction spending includes both the residential and nonresidential sectors. The chart below maps the yearly changes in construction expenditures relative to sales at building materials stores. Even when housing activity moderates because interest rates are rising or the unemployment rate is increasing, consumers often remodel their homes. Thus spending at building materials stores can continue to increase - or at least not decline as much. Again, it is important to compare the particular stock you own (wish to invest in) to the industry in general.
THE BOTTOM LINE FOR INVESTORS
The strength of the housing market has astounded economists in the past year. Forecasters are again predicting that housing activity will decrease in 2000 as softer economic growth and higher interest rates curtail residential investment.
A slower pace of housing construction and home sales eventually will lead to a reduced demand for furniture and appliances. At the same time, building materials and hardware stores probably won't see the same heady pace of sales of the past couple of years.
Nevertheless, even in a slower housing market, consumers still buy new furniture or remodel their homes. That's why companies in the housing sector may not see out and out declines in their stock price. Make sure to do your homework in this environment. When professionals tell you to buy low and sell high, it really means that you should buy companies when they are out of favor in a market lull.