Inflation is the name of the game
What the different inflation indicators are showing
Evelina M. Tainer, Chief Economist
| Change on May 14 from previous day |
Average daily change (absolute value) 1997- June 10, 1999 | |
| 30-year Treasury Bond | + 17 basis points | 5 basis points |
| DJIA | - 193.87 points | 73.63 points |
| S&P 500 | - 29.76 points | 9.40 points |
| NASDAQ | - 54.13 points | 20.99 points |
| Russell 2000 | - 7.71 points | 3.02 points. |
Inflation is always bad from the point of view of financial market players. But these days, market players are even more worried about inflation scares because the Federal Reserve is worried about inflation and indicated they might do something about it. At the May 18 FOMC Meeting, the Fed instituted a bias towards tightening. This caused financial market participants to fear that the next move would be an actual tightening - a rise in the federal funds rate target.
This article discusses the major inflation indicators and considers whether inflationary pressures are indeed percolating or the Fed is worried prematurely. Also, we will cover the impact accelerating inflation has on your portfolio.
What is inflation, really?
Simply defined, inflation is an increase in the general price level. No question that at any point in time, you could point to the price of a good or service that has consistently risen year after year. Medical care fits this description. But you can offer an alternative good or service that has decreased year after year. High technology goods such as computers fit the bill here. So do we have inflation or deflation?
The key is that we are concerned about the general level of prices - or put differently, the average prices over a variety of goods and services. Given that definition, we'd have to say that the U.S. has produced inflation on a yearly basis practically every single year in the postwar period. Yet, if we look at the composition of goods and services, we can find indicators of deflation many times in the past 30 years - even recently.
Why is inflation a concern these days?
Economists agree on very few things. Among these are the fact that inflation is everywhere and always a monetary phenomenon. What does that mean in English? Inflation can only be caused by the Federal Reserve printing too much money or essentially allowing easy credit conditions when physical resources aren't there to support them.
When the U.S. economy is operating at full throttle, it is difficult for it to grow more rapidly when sufficient workers aren't available. The only way for an employer to find additional help is to raid their neighboring producer and hire away her workers. This is done by offering higher wages or more benefits or perkier perks. No matter how you slice it, it costs the employer more money. Increased production costs are generally passed on to consumers. Ergo, that's the inflation.
In its 9th year of expansion, the U.S. economy is clearly utilizing its resources. Policymakers have generally agreed that we reached full employment when the civilian jobless rate hit about 5 ½ percent. That was a few years ago. The jobless rate is currently at 4.2 percent. Wages did accelerate from 1995 to 1998, when the jobless rate was achieving and surpassing the full employment rate. But wages have also moderated in the past 6 - 12 months. And the higher wages were not passed along to consumers in the past few years.
Federal Reserve officials are concerned that the higher wages of the past few years will have to result in higher consumer prices eventually. The spurt in the consumer price index in May took financial market players, economists and policymakers by surprise because some special factors other than volatile food and energy components led the rise. These one-time events could be signaling the beginning of further price hikes. Or they could simply be one-time events. That is the million dollar question of the day.
The next few sections will cover some key inflation indicators that policymakers at the Federal Reserve, as well as financial market participants, are following closely.
It begins with commodity prices
Commodities are the raw materials that producers use to make the goods that will eventually be sold to consumers. Commodities are the most highly competitive goods and easily tradable with foreign countries. As a result, world demand for these goods is more important than just domestic demand. The chart below shows the Journal of Commerce (JOC) commodity index. It clearly bottomed out in late 1998/early 1999. Prices are still down from a year ago, although not as sharply.
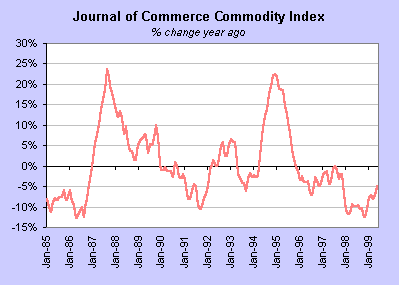
The three primary components of this index are metals, oil, and textiles. Only oil prices have turned up significantly. Metals are still lower than a year ago, but not as sharply lower. However, textiles are headed dramatically lower. What can this index tell us? Commodity prices are still down significantly from a year ago. They have a ways to go before they will look as foreboding as 1994-95 when the Fed was guided by commodity prices to raise rates.
Competition from abroad: import prices
There is no question that Americans have benefited from the misfortunes of others in the past few years. Recessions in Southeast Asia and even sluggish economic activity in Europe have curtailed demand for goods on a global basis. Perhaps U.S. shores weren't flooded with cheap imports on the heels of the Southeast Asia debacle which began in 1997, but we did get goods at lower prices than would have been in the case in a stronger global environment.
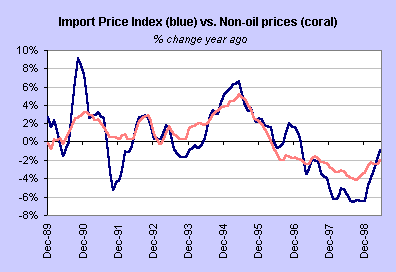
This chart shows that import prices are still lower than a year ago despite the three-month surge in energy prices. Indeed, non-oil prices are also still falling on a year-over-year basis. But just like the JOC commodity index, prices bottomed out in 1998. This series too is pointing to a slower rate of decline in prices of imported goods. What do these indicators tell us? Prices are still down from a year ago, but the best inflation news is behind us.
Producer prices at various stages of production
The producer price index for finished goods is closely followed by economists and financial market players as a precursor of consumer price inflation. In reality, the PPI for finished goods is not much of a leading indicator - more like a coincident indicator. Similarly, the PPI for intermediate goods and supplies along with the PPI for crude materials are followed as leading indicators. They tend to move at roughly the same time - the lead time is usually one or two months at the most. Do look at the Chart Room in Econoday's Resource Center to get a detailed look at the PPI for Crude Materials and Intermediate Goods & Supplies.
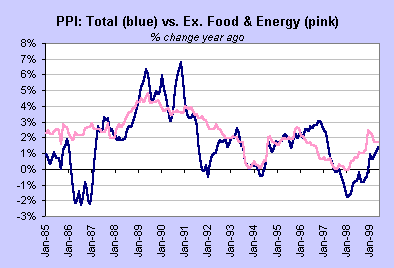
The PPI and the PPI excluding food and energy prices bottomed out in 1998 and are posting higher year-over-year gains. Nevertheless, these increases are modest on a monthly basis. Both series are running at a slower rate than 1995-96, the last time that a run-up in producer prices worried the Fed enough to tighten credit conditions.
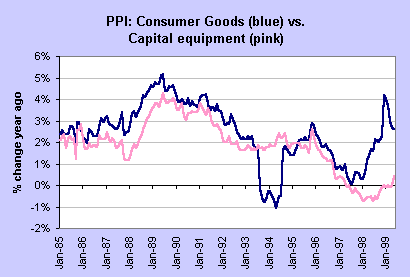
The acceleration in prices of consumer goods (less food and energy) a few months ago was concentrated in tobacco prices. These have since moderated. Capital equipment prices are rising more slowly than consumer goods, but have turned up in 1999 as well. These inflation indices do point in the same direction - upward! But the question remains whether inflation will accelerate rapidly or not at the consumer level.
Inflation from the Labor Markets
Business costs are curtailed when labor costs are not accelerating rapidly. This is good because producers don't have to raise consumer prices (less inflation) and corporate profits are higher (and stock prices are higher).
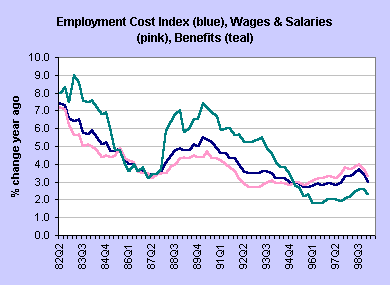
The employment cost index is the most comprehensive measure of compensation costs. Total compensation measures wages and salaries coupled with benefit costs. Since 1995, wages and salaries have risen more rapidly than total compensation. However, the costs of benefits moderated, helping to hold down total compensation costs. This has held through to the first quarter of 1999. Many economists are predicting that benefit costs will soon accelerate as health insurance gains pick up steam. The moderation in compensation suggests that labor costs are not worsening and producers may not need to lift consumer prices despite the slight uptick in wages.
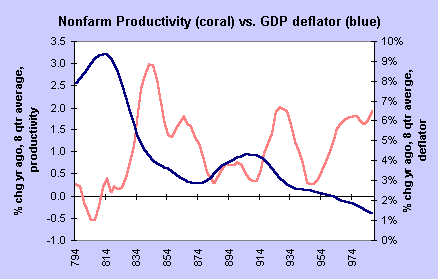
When workers produce more goods, their increased wages aren't a cost to the producer. Thus increases in nonfarm productivity allow increased wages without accelerating consumer price hikes. Nonfarm productivity is cyclical, but the trend in productivity is somewhat improved in recent years. The chart above is an 8-quarter moving average of the series - which tends to be quite jagged on a quarterly basis. Note that the GDP price deflator is still headed lower on a long term basis. (This is also an 8-quarter moving average of the series.) Higher productivity helps to curtail inflationary pressures. We are still benefiting from productivity gains.
Consumer Price Inflation
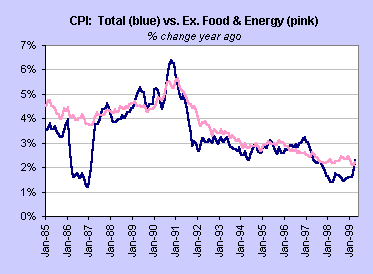
A look at the CPI inflation chart will tell you immediately that the CPI is accelerating, although the acceleration is mainly due to a surge in energy prices. We shouldn't necessarily ignore increases in energy prices, but these don't have to translate to price gains in other goods and services. Indeed, the CPI excluding food and energy is running at about the same pace as the past few years.
We like to look at the difference in price changes in the goods market versus the service sector. Prices of goods moderated significantly in 1997 and have since turned around, although are increasing at a slow rate. Prices of services of more stable, but the series is trending slightly lower. (Look at the Chart Room in Econoday's Resource Center for a picture.) The following charts show various combinations of the major CPI components.
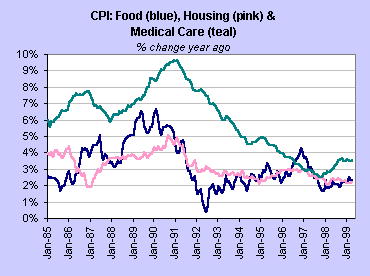
Food and housing prices were modest in the past several years compared with the price pressures in medical care.
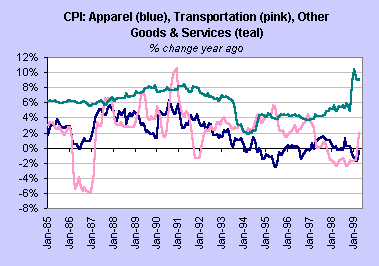
Transportation costs include gasoline, which is more volatile on a monthly basis. Apparel costs are generally modest, except for a spurt in April prices. Other goods and services include tobacco, where prices increase rapidly every year.
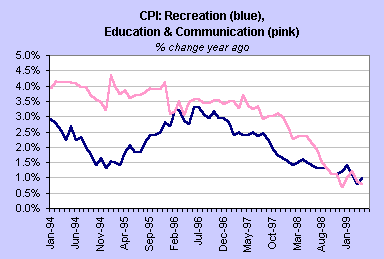
The Bureau of Labor Statistics have only begun to account for recreation, education and communication costs in this format since 1994. Note that both costs have headed lower. Communication includes computers and telephone where prices are headed lower over time.
What does the consumer price index tell us? It does appear that the best inflation news is behind us. Yet, prices are not accelerating in all goods and services. The CPI could remain subdued for many more months, particularly if economic activity moderates from the torrid pace of the past year.
THE BOTTOM LINE FOR INVESTORS
Inflation erodes the value of investors' portfolios. Bonds, as fixed income investments, are hurt more decidedly by accelerating inflation. Yet, even equity investments could be hampered by rapidly rising inflation.
Suppose that you start out with a $100,000 portfolio today and are able to generate a 10 percent nominal rate of return over the next 20 years. Your portfolio will have a value of $672,750 at the end of this period. If the rate of inflation is 2 percent a year, the inflation-adjusted or real value of your portfolio will amount to $452,741.50. However, if the rate of inflation is just one percentage point higher at 3 percent, the real value of your portfolio will amount to $372,485.40. That means that a one percent difference in the inflation rate would reduce the value of your portfolio by more than $80,000!